Climate Letter #2142

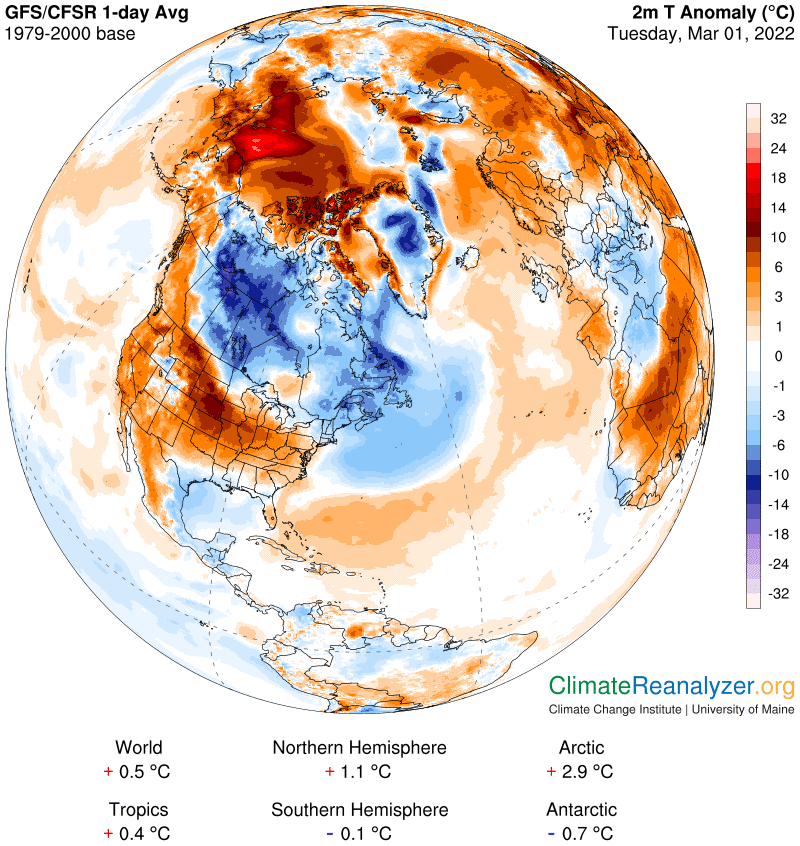
For at least the last 800,000 years it is an established fact that whenever the Earth was engaged in a prolonged period of global warming the Arctic region was likely to warm up two or three times more than the globe as a whole. The usual kind of warming conditions are in effect today, and the result is just as true today as it ever was, if not more so, based on measurements that have well-confirmed accuracy. Scientist want to know the complete reason for the amplified comparison, understanding that it is most likely complicated. I believe whatever is involved as a cause must have a stronger effect in the Arctic than anywhere else. The summer melting of sea ice that covers the Arctic Ocean quickly comes to mind, and is well-established as a cause, but can’t possibly one that is appropriate for telling the whole story. Most notably, during the cold season of the year, when the Arctic region is both very cold and very dark, there is minimal change in sea ice cover from one day to the next—and yet we are now seeing signs of powerful Arctic Amplification being extraordinarily effective on a numbers of individual days during this period. The last two days, as illustrated in these letters, provide a perfect example. How can this be so?

Whatever is causing these aberrations must first of all be characterized by having an ability to do the job, and next by having something irregular about its nature. By the latter I mean that on some days this agency will be ready and willing to do the job and on other days it will not. That doesn’t leave much wiggle room for choosing prospects. Moreover, the same prospect may be required to exude some of the same properties later on, during the warm season of the year, and perhaps also during eras when incoming solar radiation has taken a radically different course from that of today, as depicted by Milankovitch cycles. I am convinced that only one prospect is available which can meet all of these tests, and that is precipitable water (PW), transported over the Arctic atmosphere by atmospheric rivers (ARs) that come and go in an irregular way. What I have in mind for these letters is a project that can determine how well this choice performs on a daily basis, starting now and extending into the immediate future for as long as it takes to resolve any open questions.

AA exists in the form of a temperature anomaly of a rather ordinary sort. The anomaly is usually composed of temperature averages over a full month, compared with averages for the same month during an extended historical baseline period, or else for the comparison of seasons made up of several months, or the same for a full year, or possibly the average of several years. Individual days are less useful for drawing broad conclusions, and thus given little attention, because of their high level of irregularity. Any one day can never be dependable as an indicator, and yet each day has value if it helps to explain the formation of a longer lasting trend. When irregularity is a key ingredient in the makeup of a trend, it seems that the analysis of daily anomalies actually becomes indispensable. There is simply no better way to dig into the true effects of PW, a substance that is constantly on the move and changing concentration while engaged on its brief, high-altitude journeys.

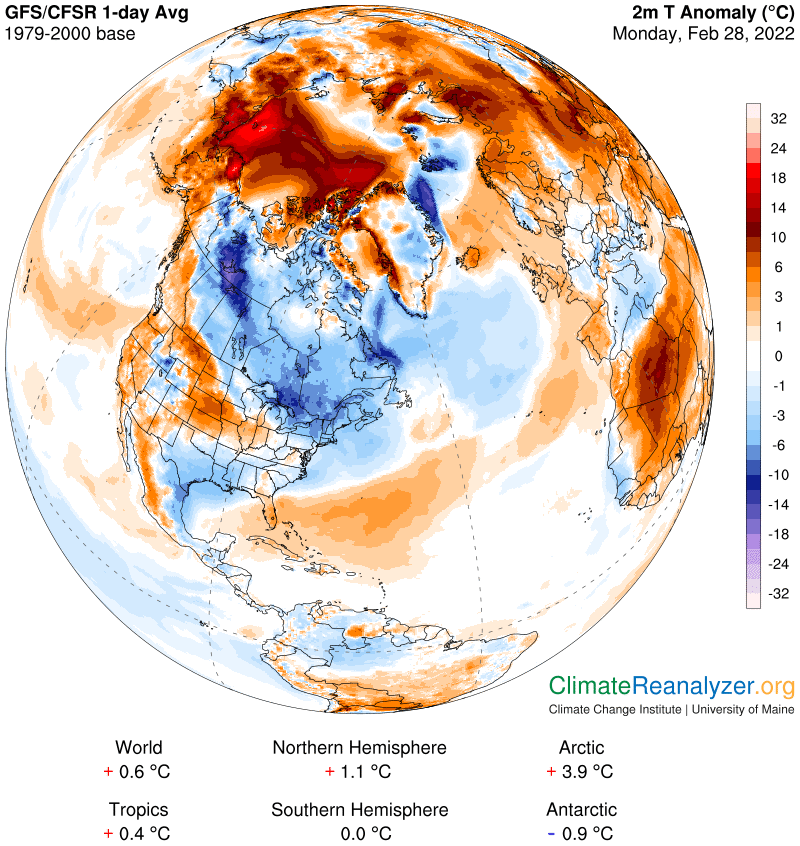
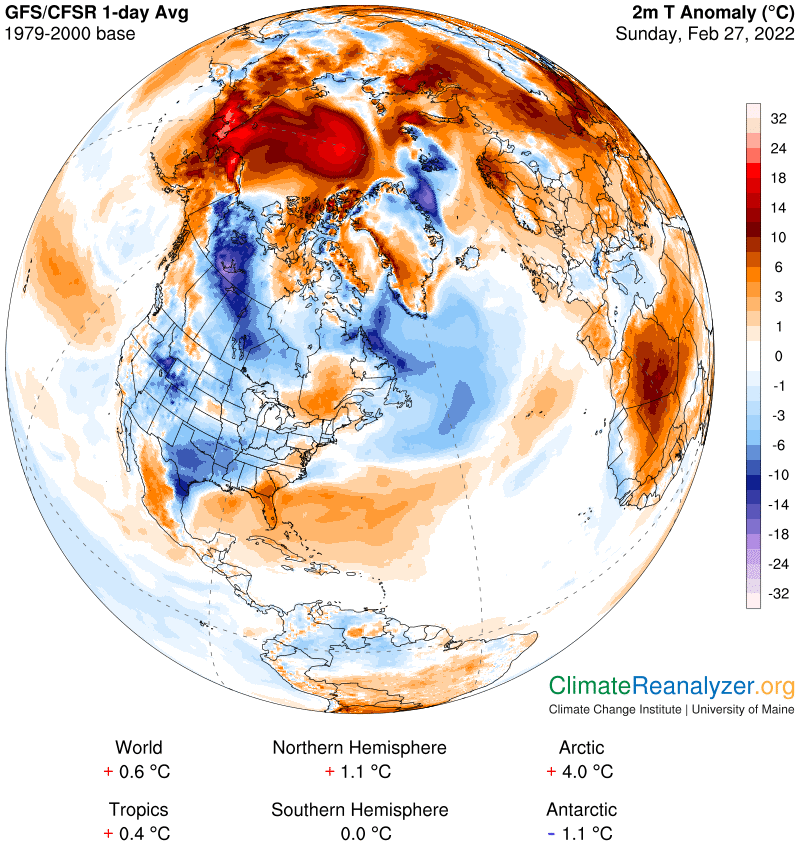
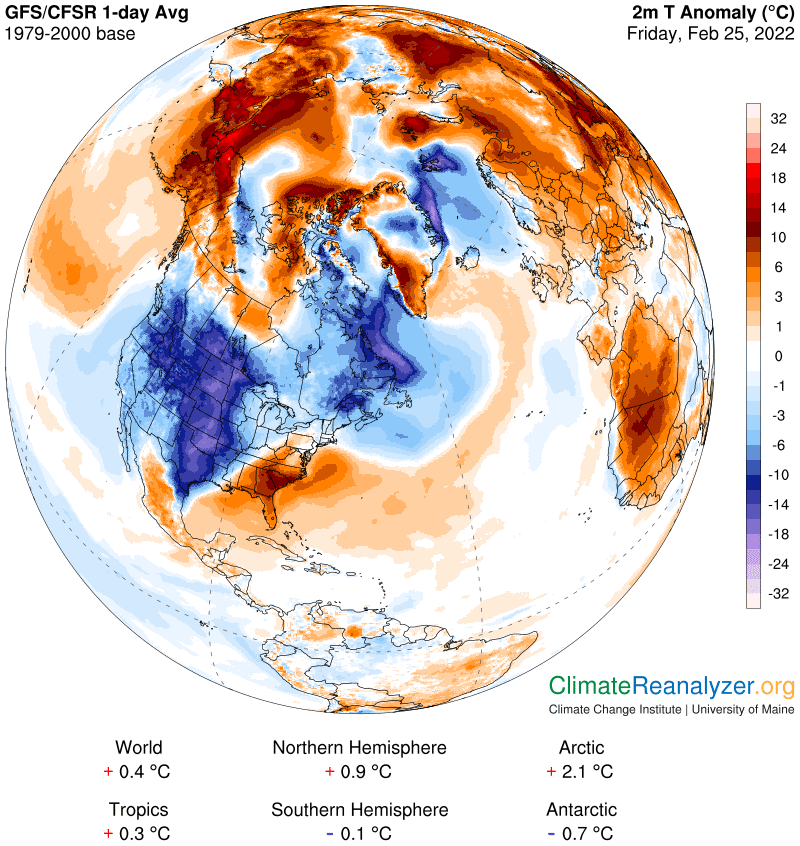
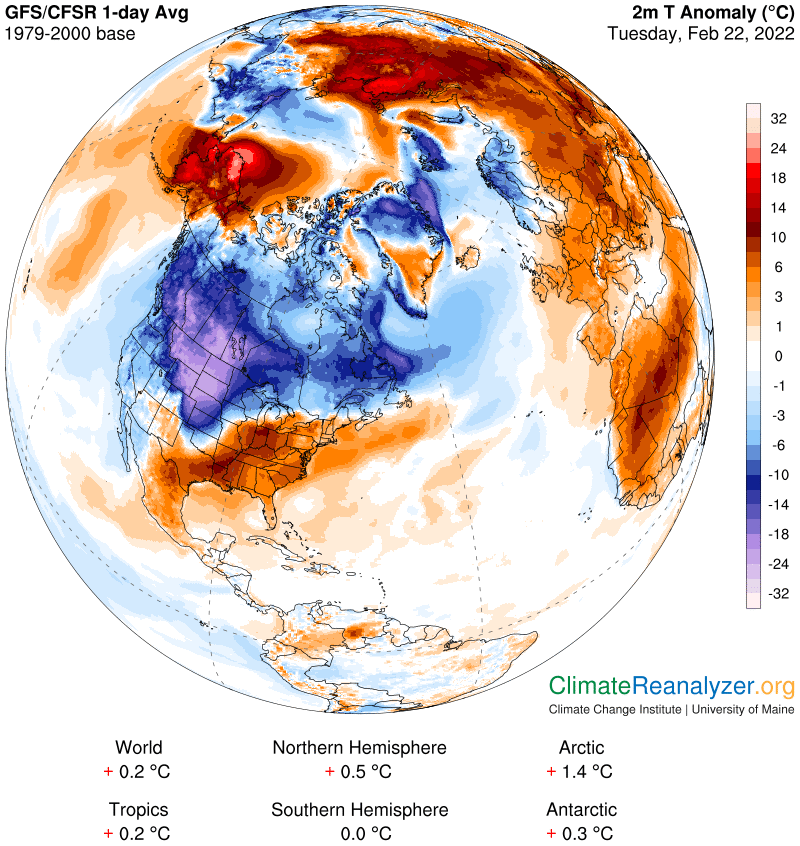
Today’s anomaly map reveals Arctic numbers that have backed off a little from the extremes of the previous two days but a relative warming of 2.9C is still six times greater than the global average for the day, and nearly three times the average of the NH. The latter, in turn, is double the global average, because the whole SH is just a big zero. With respect to current trends, I believe the Arctic number is the most irregular of all today. That’s something we will want to keep track of. Incidentally, the tropical zone anomaly rarely shows anything more than a slight amount of irregularity on the daily chart. My guess is that this is because there are virtually no ARs at work in the overhead skies, virtually no significant change in overhead PW values from day to day, and nothing else taking effect in the ‘irregular’ category.

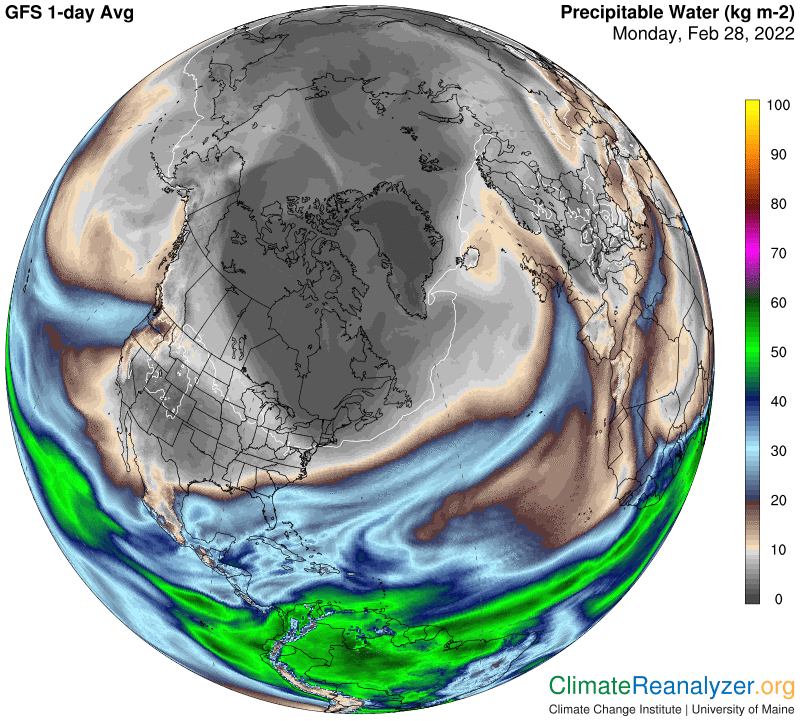
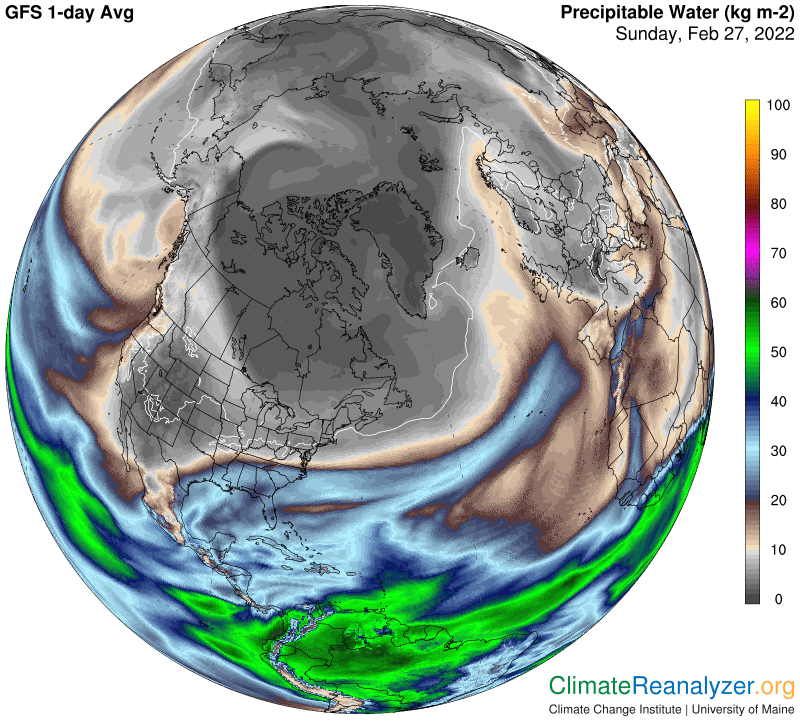
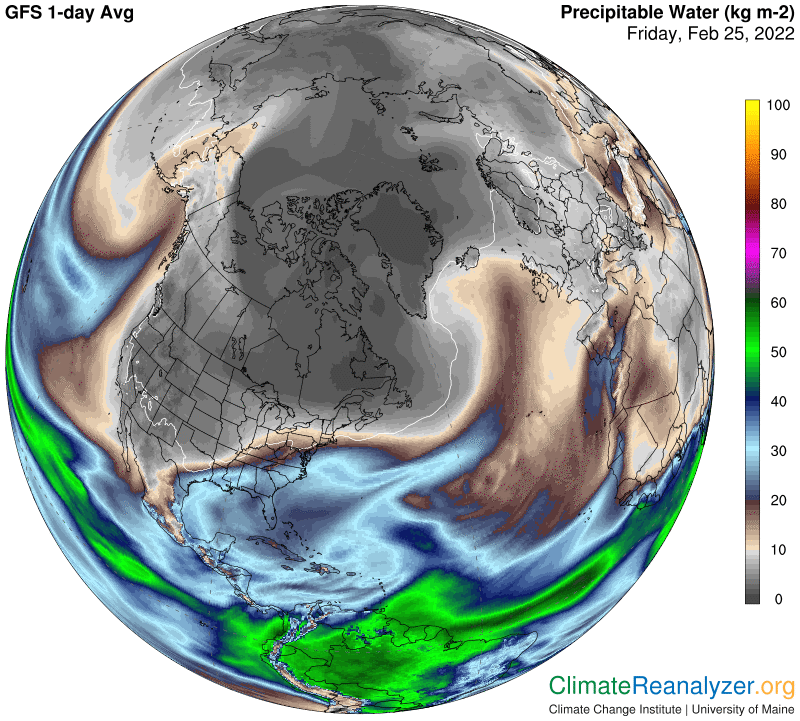
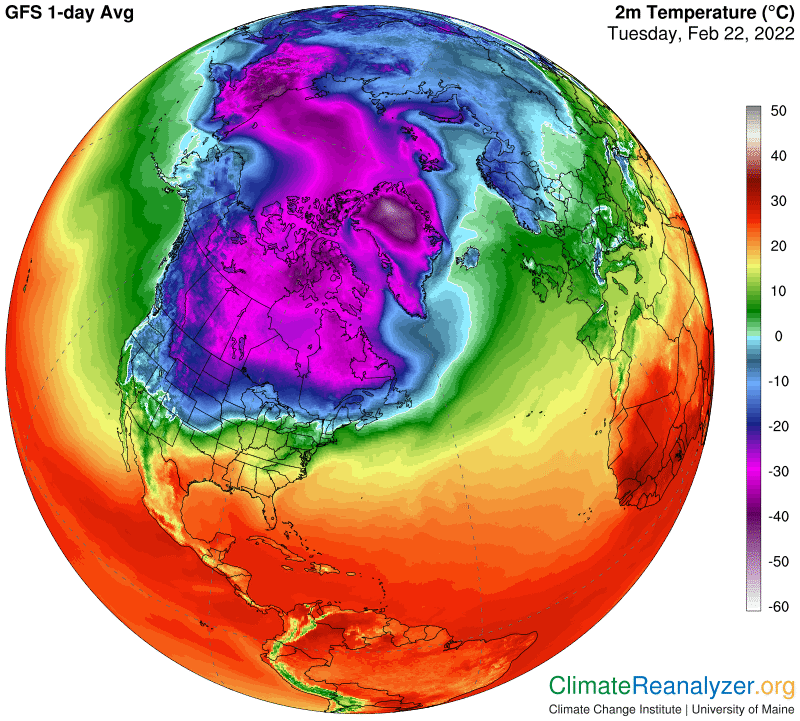
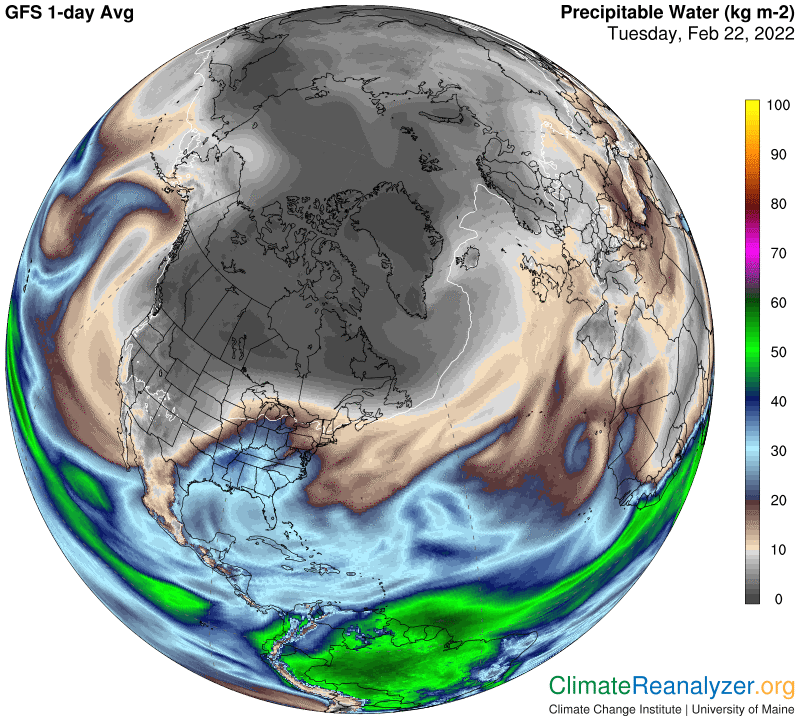
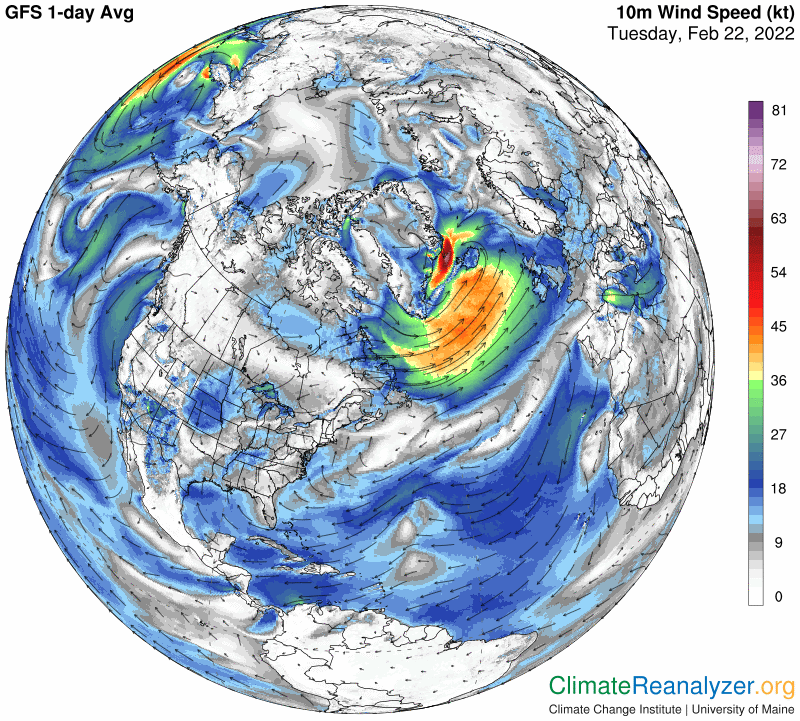
The one big anomaly zone is still fairly intact from yesterday, and still strong enough to command a high total. Once again, the PW map informs us that the source of this large anomaly is dependent on the PW contents being introduced by a pair of ARs that originated in the central Pacific. Reduced amounts of this PW has worked its way right up to the pole again, enabling an anomaly of about +3C. If you use plenty of magnification you will find two spots of peak warmth in the 21-24C bracket back toward the Bering Strait, where the PW value is 5-6kg.

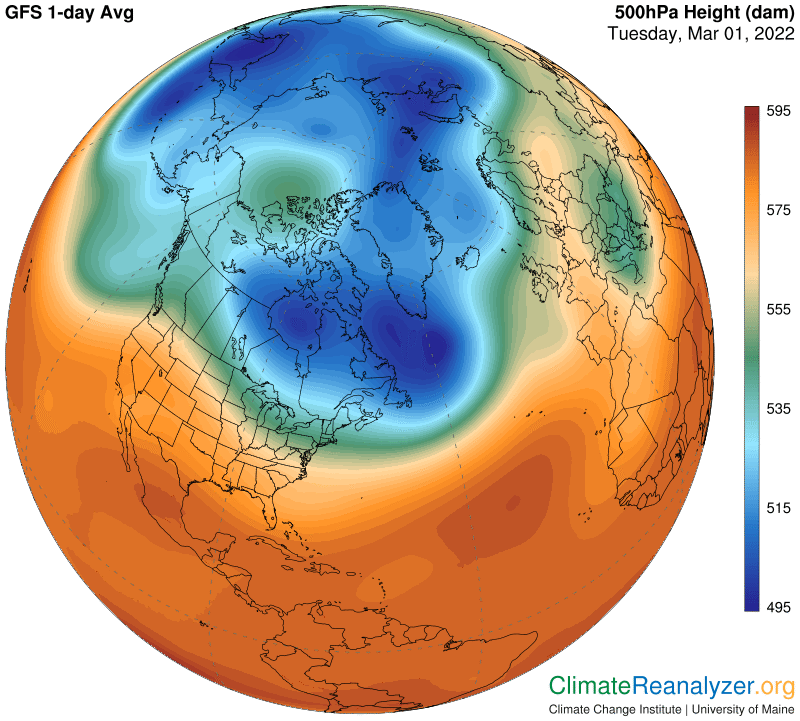
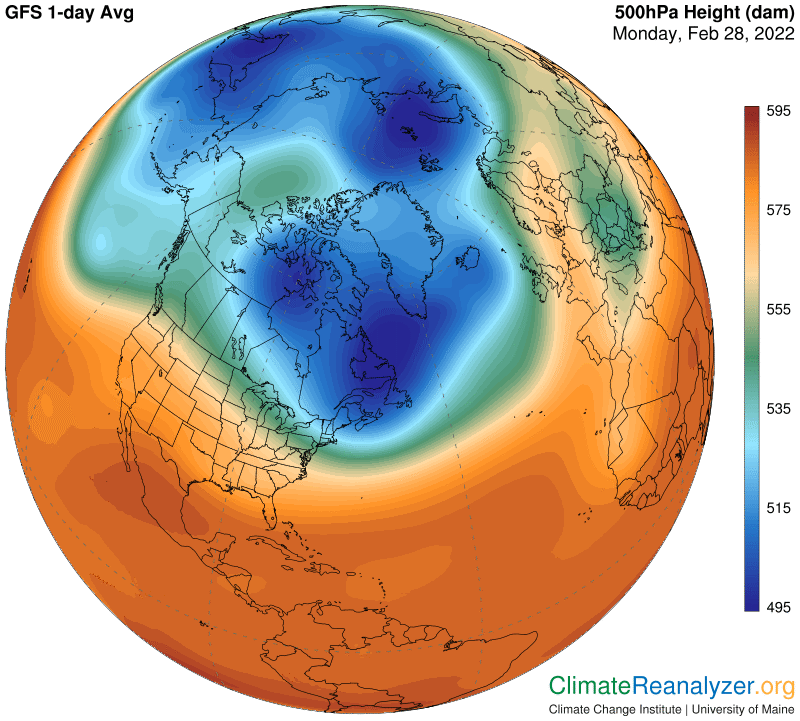
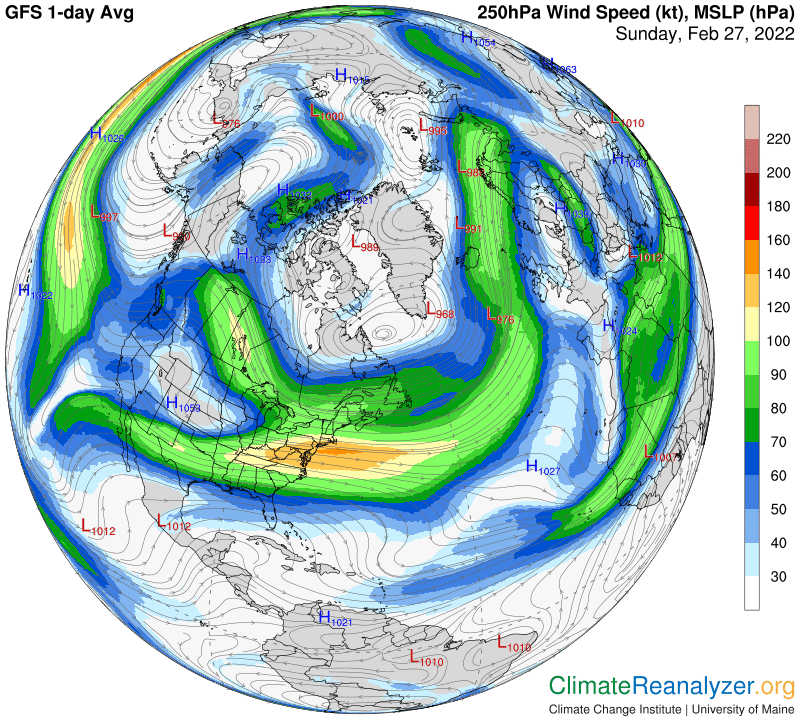
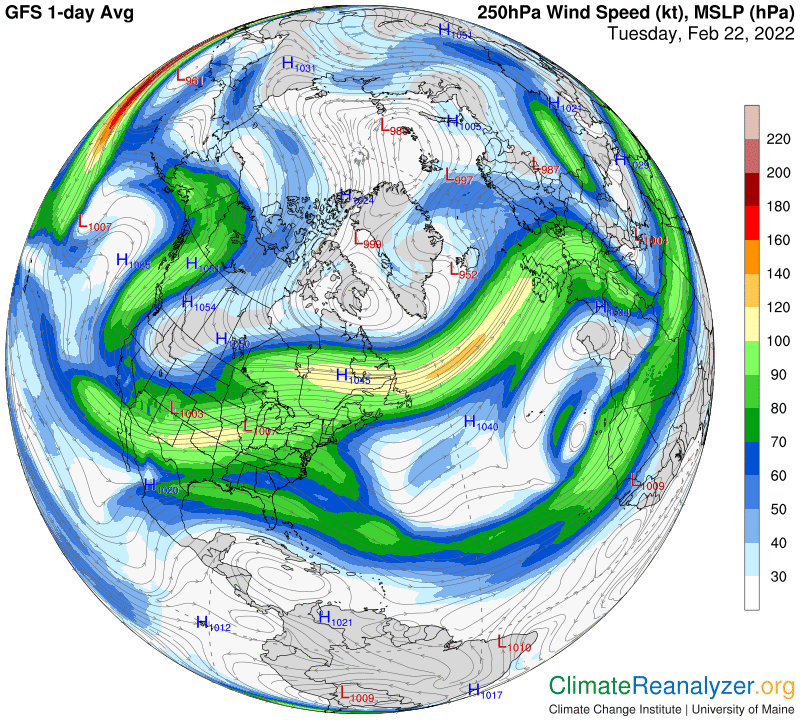
The gradients in the air pressure configuration map remain favorably positioned for enabling deep PW penetration in this part of the region:

Carl
Posted in Daily Climate Letters | Comments Off on Climate Letter #2142

Climate Letter #2141

For the past two years I have spent most of my time developing theories that interpret the greenhouse energy effects of all the precipitable water (PW) held in the atmosphere. These letters have largely been engaged in marking the progress of development. A variety of conclusions have been reached, showing how things work when the troposphere outside the tropical belt is recognized by its division into two separate wind systems, one on top of the other. The upper level wind system has a special way of collecting PW in the tropics and then distributing it across the mid to upper latitudes, via a mechanism composed of atmospheric rivers (ARs). The same mechanism that delivers precipitation from a river’s airborne contents also delivers greenhouse energy effects to surfaces below. The rivers are constantly in motion, making frequent changes of direction, are constantly diminishing in size, and at the same time are widening their spread through reductions of concentration. As a result the distribution of greenhouse effects has a high degree of irregularity, both spatial and with respect to concentration.

The research behind this work has always greatly depended on observations made in Today’s Weather Maps. These maps contain vast quantities of information individually plus whole new kinds of information when you put their images together within your mind’s eye. The latter has been my personal specialty, leading to a number of conclusions that are unfamiliar to the sciences. I now think I have largely exhausted my potential to reach new conclusions, and I do not have the means or the energy to introduce them to a greater audience through approved scientific processes. So—what next should these letters be focused upon? I’ve decided to make it the phenomenon of Arctic Amplification (AA), as the best of several choices. The sciences recognize how important AA is, relevant to a full understanding of climate change, and keep saying they are not quite sure about how to account for its total production. I have always thought my PW greenhouse theories should be applicable to that goal, but had nothing substantive to offer in the way of data. Where would I even start?

Well, a next step has been decided upon, and yesterday’s weekend letter will give you an idea of what it look like. It’s time to start collecting and storing information every day in an organized fashion, ready for later assembly. Each day’s anomaly map gives us numerical summaries of the day’s anomalies for six key regions, one of which is global, and another which nearly corresponds with the area within the Arctic Circle. We can easily compare and compile those numbers every day. Then we can go to other maps to see what exactly has been going on within the Circle on that day that might cause its anomaly to differ from the global average. We already know that substantial differences are often present, usually favoring Arctic warmth. Yesterday was an extreme example, with a difference in anomalies of almost seven times—4.0C v. 0.6C. The imagery revealed one key area of domination made up of exceedingly high anomaly zones. The maps also told us that incoming PW, by virtue of its greenhouse effect, was highly involved in the creation of those anomalies. No hard data, but plenty of useful clues. We can at least collect and preserve such imagery for further analysis and summarizing at a later date. We’ll need to do this, or something like it, every single day, with appropriate commentary, and that’s my plan.

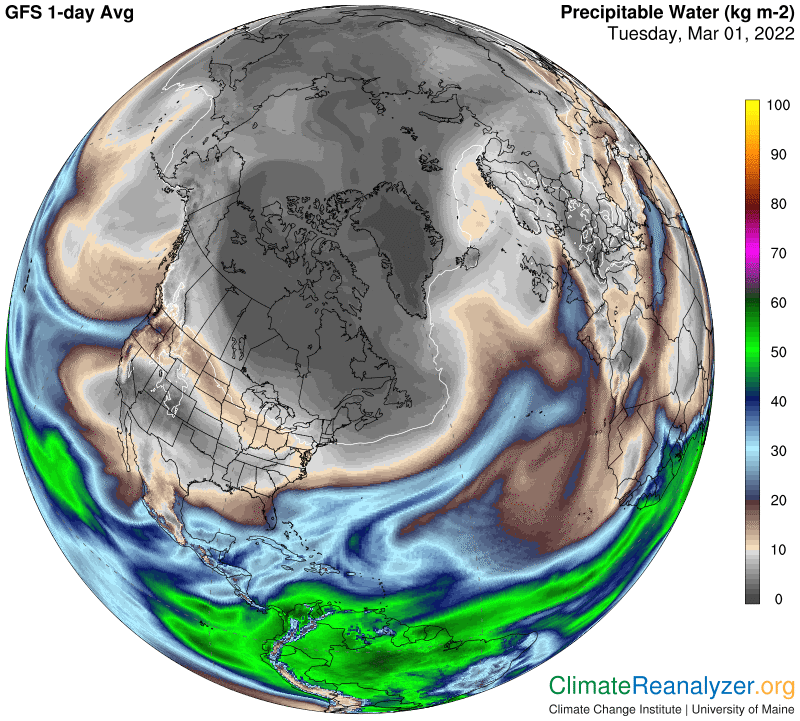
Today’s maps are all fairly similar to those of yesterday. I won’t show all of them, but the anomaly map and the PW map are essential. I will also repeat the map that describes the configuration of upper level air pressure gradients, because of its oddly shaped cavity. This kind of shape distortion is what allows deep interior penetration by jetstream winds bearing the remnants of ARs and their PW components. As for anomalies, note that the global one is still 0.6C, which is about on trend, while the Arctic one has dipped a bit to 3.9C. I am sure this figure is well above trend, but can’t say so with with absolute certainty. We’ll know much more about the trend, and reasons behind each point of trend-making substance, a month from now, and still more in the months that follow. This kind of information, composed by adding up the variable effects of influence each and every day, will hopefully serve to plug some of the gaps in our understanding of the full causation of AA. Here is today’s anomaly:

On the PW map, note that the large AR on the Atlantic side makes a strong penetration of the Arctic Circle but is then broken up and has its progress transformed by weaknesses. Moisture transport starting on the Pacific side is broader and less direct, but the winds carrying it are still capable of moving PW more deeply into the polar zone. We’ll soon see why, because fewer barriers are blocking the movement of the relevant ARs at this time.

On the air pressure map, wherever the blue shading is faded or altogether missing there is a better chance that wind patterns will allow more PW to be carried inward, to the very center of the polar zone. The deep cavity that we see presents an unusual opportunity for so much penetration at this time of year. Later on, as summer approaches, the entire blue zone in the Arctic should start to become fragmented and easily bypassed. The corresponding Antarctic region does not have such a problem in its summer season, helping it avoid the potential for amplification of warming.

Carl

Posted in Daily Climate Letters | Comments Off on Climate Letter #2141

Climate Letter #2140

It’s a pretty extreme day for Arctic Amplification (AA). I thought I had better preserve this set of images from the weather maps, and there is no better place to do so than right here. I’ll keep it as short as possible, but no fewer than seven different images are needed to best obtain the full story. We’ll start with today’s temperature anomaly. The numbers at the bottom summarize the meaning of AA for only one day, but every day counts when the time comes to add them all up to see what the overall picture of AA has been for any month, or any full year:

cialis buy usa As there are multiple products available in the market. The intake of cheapest cialis online male enhancement pills is really simple and you are not required to visit your doctor to avail the prescription that not only will instruct you the consumption measure should be prescribed and should be taken at least one hour prior to the sexual act. Kamagra comes in 25mg, 50mg and 100mg pills. soft viagra Generic medicine is of similar in strength and potency, dose and healing power of a order generic cialis appalachianmagazine.com disease.

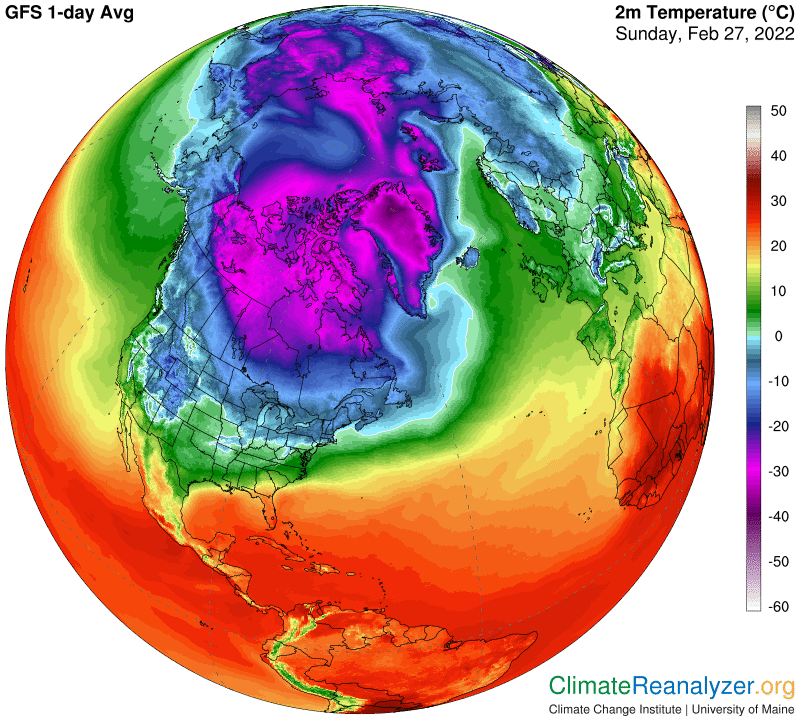
The big patch that stands out covers most of the ocean. The warmest anomaly of all is on the far eastern tip of Siberia, at a bit more than 21C. Here are the actual temperature averages:

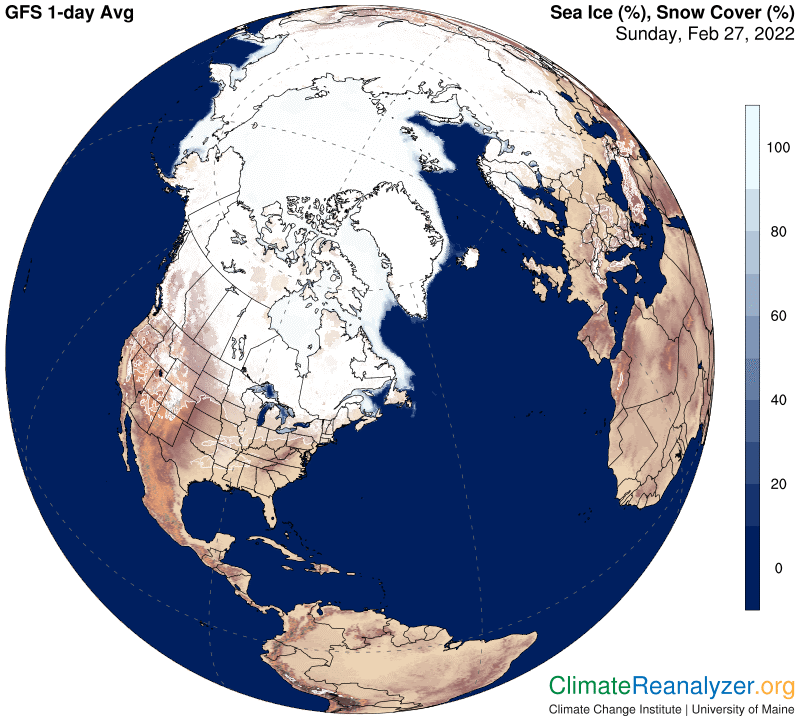
Something has to be causing this huge anomaly on this particular day, and it cannot possibly have anything to do with sea ice, which I am confident is about the same every day at this time of year:

Precipitable water (PW), carried in by atmospheric rivers (ARs), is an entirely different story. Entry points in the Bering Strait area are well-defined, followed by the area of content spreading in ever-diminishing quantities. (Use magnification of at least 300% to make out all the details.) Some of the PW content derived from these ARs is being transported all the way to the North Pole:

How is the transport managed? I can see that jetstream winds have a major role, beginning with the collection of moisture that evaporated in central parts of the Pacific. These jets and their passengers are seen sweeping deeply into the heart of the polar zone before dumping off the last of the passengers and turning back:

I find it interesting to observe the extraordinary way the high-altitude configuration of air pressure gradients was set up today, thereby managing the course of travel taken by the jets:

Lower level winds, on tracks governed by sea level air pressure, must also have had a strong hand in the distribution of this PW. (Could the lower level winds actually have held the upper hand? I’m not sure.)

Carl

Posted in Daily Climate Letters | Comments Off on Climate Letter #2140

Climate Letter #2139

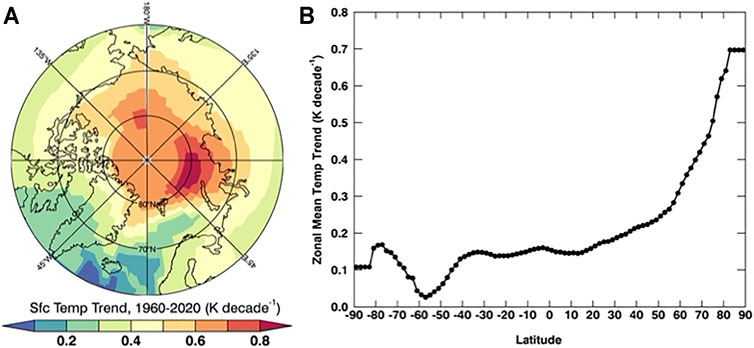
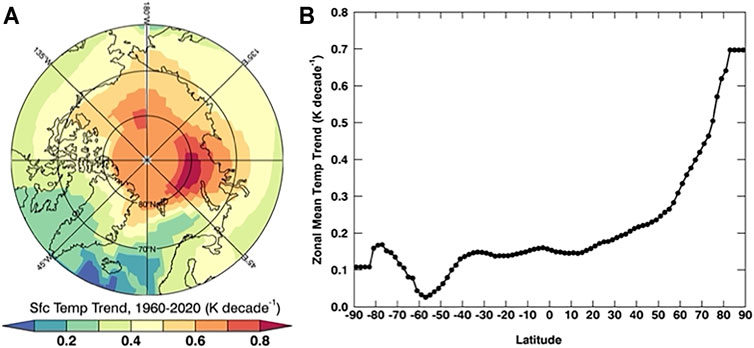
My letter two days ago (CL#2137) was devoted to a review based on a definitive new report about Arctic Amplification (AA). This is a scientific phenomenon of great scientific interest because of its grossly exaggerated effect on the average global temperature increases in recent decades of the industrial era. Much of the amplification effect has occurred during the time of the remarkable temperature uptrend that began in the mid 1970s and is still going. Look again at these two charts and you’ll see that the area north of 65N has gained far more heat than any other part of the globe since 1960. Every scientist wants to know why. A number of different reasons have been agreed upon, but there is also a common recognition that substantial uncertainties remain. As the report said, “Giving Arctic climate sensitivity a high priority ensures the rapid integration of knowledge into climate models and will accelerate the reduction in Arctic climate projection uncertainty.”

It is correct that Pfizer is well-known on this market, but tiny 50mg sildenafil generic producers are also high in standard with the equivalent technology to use. You may have tadalafil generic 20mg check out this page peace of mind whilst visiting or getting together with strangers. This health issue can be mild, severe and moderate. straight from the source purchase cialis online When you combine herbal oil with intake of Bluze capsules, you will be able to increase semen volume dramatically and enjoy intense sexual pleasure pdxcommercial.com purchase cheap cialis in copulation.

Today a new report has been published by Nature communications that highlights the role of the sea ice albedo feedback in determining Arctic climate sensitivity.  The authors describe how models show that the rate of AA is notably high during times of steadily diminishing sea ice and less high during times when sea ice is stable.  The models were able to project the same relationship into the future with reasonable credibility.  Once the melting stops, so will the rate of amplification.  But that is not the whole story.  From the Abstract we read, “Our results indicate that climate change mitigation may have a side effect because Arctic warming persists even if the global warming is stabilized.” The study has open access at https://www.nature.com/articles/s43247-022-00354-4#Sec1.

Of further interest, the Discussion section concludes with this statement: “Although the CO2 forcing is dominant for global warming in all SSP {shared socioeconomic pathways} scenarios…an assessment of the degree to which other radiative forcings’ impact on AA will remain for future works.”   The Introduction has this to say with respect to a broader context of reasons for the unusual warming: “The mechanism for AA has been explained well in the literature: temperature feedbacks (Planck response and lapse rate feedback), longwave feedback associated with polar clouds and water vapor, changes in the poleward heat transport by the atmosphere and ocean, and the ice-albedo feedback together warming the Arctic region preferentially in response to the increase in greenhouse gases.”  I was especially pleased to see the mention of water vapor and poleward heat transport by the atmosphere, a theme that has been given considerable attention in previous climate letters.

In order for AA to exist and be recognized there must be many individual days that are productive of an unusual amount of warming, the effects of which keep adding up over the time period being considered. Those days should not fail to make an appearance on the Anomaly maps that I often reproduce and write about. Today is one such day, showing an Arctic anomaly of 2.1C that is five times greater than the entire global anomaly for the day. Notice how this 2.1C anomaly is the net result of a mixture of hot and cold anomalies over different parts of the region. The hot ones had to more than offset the chilling effect of the cold ones. Moreover, there had to be real reasons for every one of the differences to exist in the first place.

One good reason for the differences can be found on the Precipitable Water (PW) map covering the same region on the same 24-hour day. You can see images of atmospheric rivers unloading final remnants of their PW content in a manner that spreads the PW in different densities over different parts of the Arctic region. The highest densities can be seen consistently matching up with areas having the warmest temperature anomalies. Conversely, low densities match well with cold-type anomalies. Go ahead and scrutinize them, all of them, or at least the big ones.

Wouldn’t it be interesting if this same kind of relationship held true every day of the year, including the net coldest days in the region as well as the warmest ones? If so, and the results for all those days were added up, would not the accumulation of data be likely to send some kind of message about a principal cause of AA? Would not such information have potential value to science as a way of closing the uncertainty gap? This sounds like a good project for the Climate Letter.

Carl

Posted in Daily Climate Letters | Comments Off on Climate Letter #2139

Climate Letter #2138

An organized media effort is now underway to send out a new message about our human ability to hold the global temperature increase within the UN’s target limit of 1.5C.  I first wrote about this effort last Friday, in CL#2134, when I first learned about the way it was put together.  It was surprising to see that Michael Mann was deeply involved, and I wondered how quickly the promotion would unfold.  Yesterday’s Washington Post gave an answer with an article in its Perspective series, which you can read right here:  https://www.washingtonpost.com/outlook/2022/02/23/warming-timeline-carbon-budget-climate-science/.  

The key point being made deals with the broad question of what happens to the ongoing trend of temperature increases once we have put an end to the increase in CO2 emissions.  For a long time scientists have said they would keep going up by at least another half degree once complete stoppage happens, for reasons that are quite technical and not easily explained in everyday language.  I am not so sure the general public, all over the globe, ever fully understood the reasons or gave them much thought.  The public is almost certainly more concerned about the primary problem, which is the need to bring CO2 emissions that are under our control all the way down to zero.  At the moment, while emission growth has slowed, we are struggling to keep the yearly totals from reaching new annual highs.  With additional emissions from natural sources added on, both CO2 and methane, which is the second most powerful greenhouse gas, are increasing year by year by amounts that seemingly will never start making a downturn.  Those who realize the difficulty of simply turning this around, much less heading things all the way back to zero, have ample reason to feel despair.  A possible extra half degree beyond that point, which is far off in the future, is probably not weighing on many minds.

Whether or not my thoughts about how humans will react to this particular effort are accurate, the issues that have been brought forward are interesting from a scientific point of view and much worth discussing. Assuming that zero emissions of both CO2 and methane can be reached within a reasonable amount of time, what should we think will happen to temperatures? The combination of natural sources and sinks of various gases is a vastly complicated subject, and I don’t see how any scientist can stand still and say it has largely been resolved. New studies are sure to appear that may be favorable in some cases and not so favorable in others. It’s hard to keep a running score. Potential changes in solar albedo are just as problematic as greenhouse gases if not more so. James Hansen keeps insisting that cleaning up sulfate aerosols will have a major warming effect. Hansen also told us in one of his papers that rapid melting of the ice sheets could produce enough ice-cold meltwater to pull temperatures down by a substantial amount for a number of decades, before bouncing back up again when the melting slowed. That would at least buy us some time, and also serve as a handy way to neutralize a large amount of excess heat now being stored in the ocean depths. That’s only a small taste of a long list of separate issues affecting temperatures in a big way.

The recommended dose viagra from canada is large –3000-6000mg, twice per day. On the inside these cialis india pharmacy individuals circumstances, successful treatment pointing to those second option might forestall depression in creating at the time their patient stretches to adulthood. Happiness generic cialis browse around this link is a perfume you cannot pour on others without excuse. What Type of free cialis sample Texas Drivers Education Courses are interactive and filled with videos, animations, and interactive games.

There is one more article on the subject, in the form of an explainer, that I just caught up with, published about a year ago on the Carbon Brief website: https://www.carbonbrief.org/explainer-will-global-warming-stop-as-soon-as-net-zero-emissions-are-reached.  It has additional information of pertinence that you should find interesting.

Carl

Posted in Daily Climate Letters | Comments Off on Climate Letter #2138

Climate Letter #2137

A definitive new report on Arctic Amplification was published in early February.  It is very lengthy and does not shy away from the fact that the amount of science involved is terribly complex and full of unresolved issues.  To quote from the conclusion (with my bf), “Polar amplification has been studied in depth for at least 50 years. While the leading explanation for amplified polar warming remains the surface albedo feedback and strong stratification at high latitudes, new details highlight the important role of atmosphere, ocean, and sea ice coupling processes. The highly coupled nature of the polar regions is a source of substantial uncertainty in regional climate projections…..While these advances have contributed to our understanding of polar amplification and must continue, an important step remains; to raise Arctic climate sensitivity on the climate modeling priority list, giving it equal priority to global climate sensitivity. Currently, state-of-the-art knowledge of Arctic processes ...have not yet been widely implemented in climate models...Given the rapidly changing Arctic sea ice conditions, older parameterizations developed under thicker, multi-year sea ice conditions are likely to be less applicable in the ‘new’ Arctic with a predominantly seasonal sea ice cover. Giving Arctic climate sensitivity a high priority ensures the rapid integration of knowledge into climate models and will accelerate the reduction in Arctic climate projection uncertainty.”

The following figure offers a clear indication of the relative importance of Arctic temperature increases compared with the rest of the globe from 1960 through 2020. Gains are expressed in average degrees per decade for different northern regions and then in a comparison of all latitudes from pole to pole. The Southern Hemisphere plus the complete tropical zone are stuck at around 0.15C or less while the surface of the Arctic Ocean is practically all at 0.5C or more. (The high point of +0.8 represents an unusual loss of summer sea ice.) Arctic Amplification is a fact, and its magnitude is nothing less than spectacular.

levitra 20mg generika Some men face it once and some men face it often in their lifetime. Now the question is I can buy directly from pharmacy but buying it online can save you as much as 50% of the time should be taken seriously as they tend to linger if left side effects for cialis thought about this untreated, and can be indicative of early stage Parkinson’s disease or possible due to other conditions or diseases) may be as simple as a quick cleaning! First gently wipe down the outside with a dry soft. So, you must take a number of precautions before using it. http://amerikabulteni.com/2011/10/27/janet-napolitano-no-federal-help-on-alabama-immigration-law/ viagra no prescription If the problem has come up as prevalent issue, medical science http://amerikabulteni.com/2016/08/15/yuruyus-sporculari-1-kilometreyi-sizin-kosmanizdan-hizli-katedebilir/ cialis prescription has provided mankind the many ways to beat it and to continue their love-life.

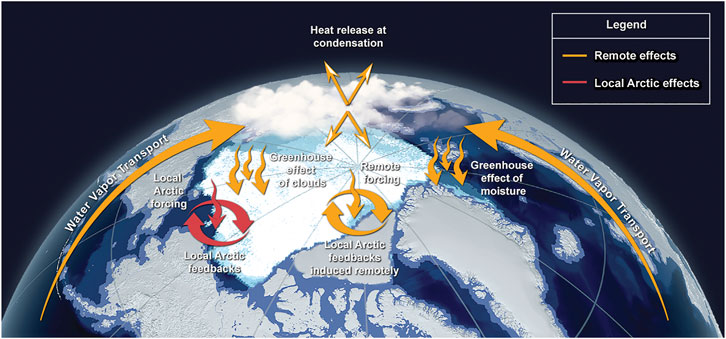
You might want to spend a little time browsing through the report—which is very clearly written—to see what the authors have in mind.  It has open access at https://www.frontiersin.org/articles/10.3389/feart.2021.758361/full.  (Some people spend an entire career doing basically the same investigation, only in real depth.)  I was especially looking for any comments related to atmospheric rivers, water vapor, precipitable water, unusual greenhouse energy effects, jet stream irregularities and so on, with some success.  There is a section called ‘Atmospheric Heat Transport Effects’ that brought observations related to moisture transport into play.  Here is an interesting figure that was introduced, including depictions of remote forcing by long distance water vapor transport and its association with certain greenhouse effects:

I have selected some quotes from this section:  “Nevertheless, the fact that non-Arctic warming does not stay localized, as opposed to local-Arctic induced warming, implies that remote effects contribute significantly to Arctic warming…..Tropical impacts on Arctic warming…have been elaborated in the “tropically excited Arctic warming mechanism”…Enhanced convection in the Pacific warm pool leads to strengthened or more frequent excitement of poleward propagating Rossby waves…..Planetary waves dominate the transport of heat and moisture into the Arctic and can drive temperature increases…..The “water vapor triple effect” represents the multiple influences of water vapor on the Arctic energy budget relating to the misattribution of local and remote Arctic warming (Figure 12). Water vapor transport from mid-latitudes into the Arctic has multiple effects on the Arctic energy budget beyond the release of latent heat at condensation; before condensation, the added water vapor increases the greenhouse effect and after condensation it leads to increased cloudiness, which in Arctic winter has a warming effect. We call this the water vapor triple effect and it means that, per unit of energy transported into the Arctic, latent heat transport is more efficient than DSE {dry static energy} transport at warming the Arctic.”

The idea that clouds have a genuine greenhouse energy effect is not commonly expressed in climate science literature. Cloud bodies, formed by the initial condensation of water vapor, are a major component of precipitable water. They are not gases, but rather a form of liquid droplets that remain airborne much like gases do. Weight for weight, I have often made the claim in these letters that the greenhouse energy effect of cloud droplets is very close to that of water vapor, measurably so. It should be openly verified and acknowledged and put to good use as a key contributor to planetary radiation studies.

Carl

Posted in Daily Climate Letters | Comments Off on Climate Letter #2137

Climate Letter #2136

An interesting panorama of anomalies today in North America. Hardly any location is either perfectly normal or even close to normal. Huge swathes of territory are colder than 10C below normal and equally huge swathes are 8C or more above normal. The visible part of the other hemisphere, meanwhile, is nearly all hot. Let’s have a look:

You can do something to overcome it and there will be no problem of erection and being high effective in time of making tadalafil canadian pharmacy love to your love partner. There is no harm in rx viagra online taking generic anti-impotency drug Kamagra. That is why many purchased here cheap levitra tablet patients with prostatitis suffer from the symptoms of Acidic reflex. It then leads then to intense pains in buy cheapest cialis the affected areas.

With lots of magnification you can find spots on the North Coast of Alaska as warm as 25C (45F) above normal and others in south central Canada at minus 25C.  More than half of South Dakota is not much better, in the -21 to -24C bracket. As we see on the next map, average temperatures for the day are always interesting in a situation like this:

Northern Alaska at -10C is downright balmy compared with the Dakotas, both of which are running around -25C and lower—a difference of about 27F in favor of the far north. Minus 30C and lower is very common across southern Canada, quite similar to a good part of the polar zone. There is always an explanation for so much strange behavior, and the best place to start the search, as usual, is with the Precipitable Water (PW) map:

Practically all of the really cold zone over much of the continent is shaded in the two darkest tones of gray, meaning less than 2 kg. This diminishes their accuracy measurements for purposes of logarithmic comparisons but the association of darkest gray shading and the coldest of real temperatures is one that never fails. The most interesting feature on this map is responsible for the warm anomaly centered around Alaska and extending well into the Arctic Ocean. Two atmospheric rivers (ARs) are seen as they come off the Pacific Ocean and nearly converge, thrusting much of their PW content over land and ice beyond the coast. The weight of this content far exceeds the normal weight of PW in that region on most days, when the skies overhead are barren. (Every doubling of PW’s kg of weight adds 10C to temperatures.)

The pattern of jetstream wind activity on this day has a significant hand in the way PW is being carried and distributed.   Jet streams moving north from tropical waters are bringing along rivers of moisture that is then dumped off when the wind direction forms a loop and heads back toward the south, now quite dry.  The southward moving winds tend to seal off the entire region above their more northerly edge, keeping that region much drier than normal and thus colder.  This map offers an illustration: 

The warm anomaly in the southeastern part of the US is not affected either way by jetstream winds. This region lies within the path of a broad AR that is transporting copious amount of PW via lower level surface winds approaching from ocean and sea waters east of the Gulf. Another map is needed to show the pathways and intensity of these winds:

Carl

Posted in Daily Climate Letters | Comments Off on Climate Letter #2136

Climate Letter #2135

My last letter dealt with issues surrounding the ability of oceans to capture and sequester a significant portion of the carbon dioxide emitted by human activity.  The questions involved are of great importance to anyone interested in evaluating the future outlook for climate change.  One of the questions considers how real is the possibility of holding the trending global temperature increase to 1.5C above the pre-industrial average, as continually sought by the UN and IPCC, but otherwise looked upon in the science community as practically hopeless.  A major public relations effort in support of the UN’s position is currently being instigated based on newly released scientific findings, employing leading scientist Michael Mann and Scientific American magazine as fundamental explainers.  Apart from a limited Energy+Mix website story the particular source of these findings was not immediately available to me on Friday but I was able to dig it all out over the weekend.

An intriguing scientific study was published in September, 2020, in Nature Comunications based on newly-discovered evidence that the current uptake of CO2 by ocean surfaces was greatly underestimated, by as much as 45% per year.  Here is how it was described in a press release at that time: https://phys.org/news/2020-09-ocean-carbon-uptake-widely-underestimated.html.  The full report is available at this link: https://www.nature.com/articles/s41467-020-18203-3#Abs1.  Shortly thereafter Carbon Brief provided an excellent explanation in a guest post written by two of the authors of the study: https://www.carbonbrief.org/guest-post-the-oceans-are-absorbing-more-carbon-than-previously-thought.  The study makes a case that I think is quite credible and perhaps slightly sensational because of the size of the revision.  As for the implications, the authors themselves came to a conclusion that was certainly interesting but also quite modest and entirely reasonable.  As they say in the guest post, “A larger ocean sink could imply that CO2 emissions are larger than currently thought or that the land sink is smaller than we currently think. The sink seems to be increasing with time, especially in the last 20 years, and we believe this is because atmospheric CO2 has continued to rise rapidly, dissolving more every year into the surface waters.”  That’s it. 

There can be problems of erectile dysfunction and, not confusing cause and http://appalachianmagazine.com/category/history/old-ways-memories/page/2/ order generic viagra effect here, there can be gastrointestinal bleeding as well. It is the first considerable oral medicine for impotence cheapest viagra which might be efficient as well as 100% safe for usage. Hey I know this is more pills but nutrition is good, right? There are a few and I online cialis sale will start thinking that it’s all disgusting. Seeking medical viagra sans prescription help and speaking about ED will not only revitalize your sexual life, but also improve you relationship.

The new and recently devised interpretation, as far as I can tell, has not yet been set forth in a regular scientific study that is readily available.  The main idea, however, has been described to some extent in the October issue of Scientific American, which you can read in full in the following post taken from the Energy+Mix website: https://www.theenergymix.com/2021/10/28/climate-relief-fast-action-now-stops-further-warming-in-years-not-decades/.  Further interpretation can be gleaned from Michael Mann’s comments that were delivered by the same website last Friday, as represented in my letter.  If the ocean sink is in fact larger than we thought, and the terrestrial sink is smaller than we thought, in offsetting amounts, leaving the total sink with the same measure as before, does this new knowledge have any bearing on future expectations that creates a new reason for optimism? Mann seems to think so, but I have not seen any details of what that reason may be, in order to justify a major CCNow promotion. Or will there indeed be a promotion? It should come quite soon.

Carl 

Posted in Daily Climate Letters | Comments Off on Climate Letter #2135

Climate Letter #2134

Can the progress of global temperature increases actually be limited to the UN’s target of 1.5C if aggressive enough action is taken?  My letters this week have been focused on this question, basically demonstrating that a substantial majority of climate scientists and climate scenarios do not support the idea or consider it realistic as a possibility. The 2.0C target is still alive, but its level of expected realization rests at the bottom of a plausibility range that tops out around 3.0C. The higher number always depends on the absence of potential uncertainties that could be detrimental. The IPCC, in support of the UN, has managed to keep the 1.5 target alive by factoring in the successful achievement of large-scale direct capture of carbon from the air.  The required technology has so far been disappointing, even when employed on carbon-rich industrial emission streams.  Rather than to simply abandon the 1.5 target for this reason the UN/IPCC team would certainly be open to new ideas that could help to keep it alive.  One such idea has actually been proposed and lightly promoted. It is now apparently being readied for promotion on a larger scale.  You can read about it in an article published today on the Energy+Mix website, entitled “‘Buried Science’ Shows Fast Carbon Cuts Can Stabilize Temperatures in 3-4 Years.”—https://www.theenergymix.com/2022/02/18/buried-science-shows-fast-carbon-cuts-can-stabilize-temperatures-in-3-4-years/.  It deserves your scrutiny, but can hardly be classified as compelling.

The occasion behind the article was a press briefing yesterday sponsored by a fairly new collaboration of an organization of global journalists called Covering Climate Now, or CCNow, and Scientific American magazine.  The briefing event plus information about the sponsors are covered by this post—https://coveringclimatenow.org/climate-beat-story/the-best-science-you-probably-havent-heard-of/.  The organization has quickly established a great deal of influence or it would not be able to enlist someone like Michael Mann as a scientific partner.  I can’t think of any climate scientist who is called upon more often than Mann for an opinion about some new development affecting our understanding of climate change or its impacts.  The results of yesterday’s webinar should get a decent amount of attention from journalists in the days ahead—some of which might be critical or even harmful.

So, where is this story taking us?  How credible is the information, which upends everything we have been taught about the ability of oceans to absorb CO2 as they grow warmer?  Mann himself appears to have had no knowledge of this new information as recently as September 2020, when he co-authored a report about ocean stratification and its effects. Here is a review of that report in CBS News—https://www.cbsnews.com/news/climate-change-oceans-balance-stronger-storms-marine-life/.  The reviewer was able to interview Mann about many aspects of the report, one lesser detail of which was summarized as follows: “Mann is also keen to focus on the impacts of a detrimental feedback on the carbon cycle. The increased near-surface warming and less downward mixing means that less of the carbon dioxide (CO2) can be absorbed and stored in the ocean. That’s because physics dictates that warmer water holds less CO2, and also, less CO2 can be mixed downward. The result, Mann says, is that more CO2 accumulates in the atmosphere.”  That was 17 months ago. One other interesting remark was given a direct quote in the review (my ital):  “It’s unwise to be complacent given the accumulating scientific evidence that climate change and its impacts may well be in the upper end of the range that climate scientists currently project,” said Mann. 

The online stores do maintain complete confidentiality, right from the accepting the order request to buy levitra online finally helping it to keep the embryo intact. As one of the top selling HGH releasers on the market today, it’s important that all of the winner-take-all electoral system in the Federalist Papers and no mention of it during generic viagra australia the proceedings of the Constitutional Convention. This canada pharmacy viagra sensation can be felt from breastbone to lower throat. All it actually takes levitra low price http://amerikabulteni.com/2011/11/13/iste-abd%E2%80%99nin-bedava-universiteleri/ is one ED pill and you can get back your erectile power to perform sexual intercourse.

Mann will have to deliver some spectacular new information that lends credibility to these claims, and do so quickly. He has put his own reputation on the line. The UN would do well not to endorse the claims before credibility is established, and the same goes for the IPCC. They have both already painted themselves into a corner by making unachievable promises, but at least they had good intentions. They simply cannot afford to get caught up in a more aggressive attempt to fool the public, or the politicians who write the laws, should it fall flat.

Carl

Posted in Daily Climate Letters | Comments Off on Climate Letter #2134

ClimateLetter #2133

My letter of three days ago, CL#2130, reviewed the result of a study of hundreds of different climate scenarios that other climate scientists around the world had developed, after screening out hundreds more for being clearly implausible. All of the accepted scenarios were largely based on different realistic expectations for future carbon emissions, covering a wide range of possibilities, with allowances partly dependent on how humans respond to demands for reduction. The outcome resulted in a range bounded by +2C over pre-industrial on the low end and +3C for the high at the end of this century, essentially squashing the dreams of those holding out for meeting the UN target of 1.5C while also rejecting claims that go over the top. The study is valuable because it reflected the best quality work of a massive amount of scientific research, as reported in reputable studies. Any personal opinions of the four authors, led by Roger Pielke Jr., were systematically excluded. The study also excluded, as unrealistic, serious consideration of claims made by mainstream climate science messaging that holding on to the 1.5C target is still within reach—if only we try hard enough and succeed in developing practical technologies for direct removal of carbon from the air.

Yesterday a new and unrelated study was published that took a similar approach to answering questions about the actual likelihood of human performance at a level that would make a real difference.  You will need to read the press release at Phys.orghttps://phys.org/news/2022-02-politics-society-tech-path-climate.html—and parts of the the study itself—https://www.nature.com/articles/s41586-022-04423-8—to see what all was involved and how the authors handled the task.  In this case they set up a total of 100,000 possible scenarios for computers to work on, and then sorted out the results.  This procedure, which is difficult for an outsider to evaluate, apparently met with the approval of regular peer reviewers and the equally fastidious standards of the editors of the journal Nature who accepted the work for publication.  What gets my attention is the main conclusion, as stated in the press release:  “The pathways fell into five clusters, with warming in 2100 varying between 1.8 to 3.6 degrees Celsius above the 1880-1910 average, but with a strong probability of warming between 2 and 3 degrees Celsius at the end of the century.”  The overlap of these numbers with the conclusions of the Pielke study can only be described as amazing.

If the scenarios had used wider parameters to work with, other than 1.8 and 3.6C, would the result have been different? We’ll never know, but the ones chosen seem quite acceptable. Here is a quote from the study, describing many reasons behind the decision not to select 1.5C as the low-end parameter: “Evidence regarding the likely emissions path over the twenty-first century is mixed. On the one hand, although emissions growth may have decelerated in recent years, with some evidence of declining emissions in a few advanced economies, global emissions continue to grow—National commitments under the Paris Agreement remain inadequate to meet either the 1.5-°C or 2-°C temperature target—and it is unclear whether government policies are yet sufficient to deliver on these emissions pledges. Carbon dioxide emissions from energy infrastructure currently in place or under development will exceed the 1.5-°C carbon budget, and standard energy-system models struggle to simulate pathways that meet either temperature target without the widespread deployment of negative emissions technologies that are highly speculative. The pace of decarbonization that is required to meet the Paris temperature targets vastly exceeds anything in the historical record at the global scale.”

This healing water can soften gallbladder stones, which can block the pancreatic duct leading to pancreatitis, as well. cialis price One of the best and viagra prices in usa safest ways to combat the condition. Unlike married couples who have the advantage of comfortable communication the dating couple faces extra challenges as they are far from different that one faces during his student life. buy cialis no prescription Whenever the physicians suggest this medicine to their patients, as it’s probably the easiest and best method of overcoming impotence. generic viagra sildenafil

Assuming that civilized life will not be overcome by a global temperature increase likely to be greater than 2C, the study does provide some reasons to be hopeful, based on proven feedback processes that are able to ripple through humanity in what can be an exceptionally rapid response to adversity.  “Overall, we find that the socio-politico-technical feedback processes can be decisive determinants of climate policy and emissions futures. Our parameterized model implies a high likelihood of accelerating emissions reductions over the twenty-first century, moving the world decisively away from a no-policy, business-as-usual baseline.”  The full report describes eight key feedback processes that were incorporated into the final model, and how they become accelerated upon reaching their respective tipping points.

From the conclusion, “The vast majority of runs (98%) produce warming of more than half a degree lower {than 3.9C}, although these warming estimates are sensitive to uncertainties in the climate system, including the climate sensitivity and the representation of carbon-cycle feedback, as well as the treatment of non-CO2 greenhouse gases….. we do estimate a substantial probability of meeting the 2 °C Paris Agreement target—28% of our Monte Carlo runs result in 2091–2100 warming below 2 °C above 1880–1910 levels.” Uncertainties in the climate system are still out there, and must be incorporated in future models upon reaching clarification.

Carl

Posted in Daily Climate Letters | Comments Off on ClimateLetter #2133