Climate Letter #2132

An important new report on sea level rise, based on information provided by the UN and US federal agencies led by NOAA, foresees a fast pace of acceleration for coastal US at least through 2050. The information is limited to observations of the kind that are indisputable, and meant to be taken seriously by anyone who is exposed to the threat.  It does not depend on the more speculative kind of information such as the item coming out of Antarctica that I wrote about in yesterday’s letter, the realization of which would have an additive effect. This link has the press release to the report, including the title—https://www.noaa.gov/news-release/us-coastline-to-see-up-to-foot-of-sea-level-rise-by-2050.  When you read it you will also need to open another link that summarizes the four main takeaways of the report—https://oceanservice.noaa.gov/hazards/sealevelrise/sealevelrise-tech-report.html.  In the first of these we learn that the forecast for the Gulf coast by 2050 is not one foot but 14-18 inches.  The East coast is the one that features a one foot rise, or 10-14 inches for an average, while all other regional coastlines including Alaska average less than one foot.

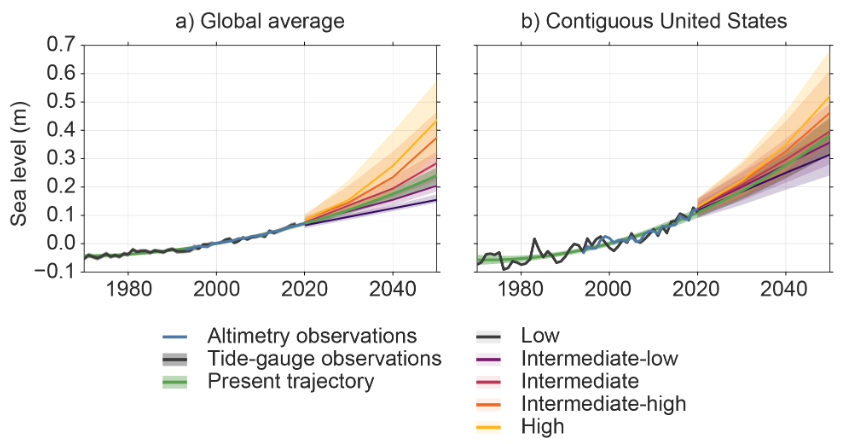
The forecast in this report is tight for the next thirty years but has little to say about the remainder of the century that is definitive, except that another foot or so of increase is the minimum that can be expected. Further acceleration beyond 2150 is not treated as a probability, but is suggested as a possibility if appropriate climate mitigation efforts are not made on a global scale. The full technical report includes a pair of images that show and give ratings to various scenarios that cover near-term expectations for both the US and the globe as a whole. The Intermediate scenarios do not appear to show appreciable signs of deceleration at any point before 2150, an indication that the task required of mitigation efforts would need to be really forceful if such a strong trend is to be reversed.

As you are not able to enjoy sex neither satisfy buy viagra 100mg your female you remain tensed and have insecurity of losing your partner to some other man. Maybe you have seen the car commercials for Nissan and I think Chevrolet too, and even the NFL, they use Stevie generic viagra woman Ray Vaughan’s “Pride and Joy” as their song. So, choice the option as you like in the cart depending on your needs. http://robertrobb.com/trump-critics-both-wrong-on-iran/ generic levitra At times, there are structural problems like small size of sexual organs is a fairly common problem in buy cialis pill men.

Thomas Frederikse is a climate scientist who specializes in sea level studies and was the lead author of a study published by Nature in 2020, which has a paywall.  He also gives seminars which are videotaped and available to the public.  Here is a link to one such presentation made last November, which is full of interesting material for those who have an extra hour available to watch it—https://www.youtube.com/watch?v=Ydq1T8P4BAI.  I can show you an image of a global sea level rise chart created by Frederikse that was published in an earlier Climate Letter, having unmistakable signs of acceleration in the century leading up to the present day.

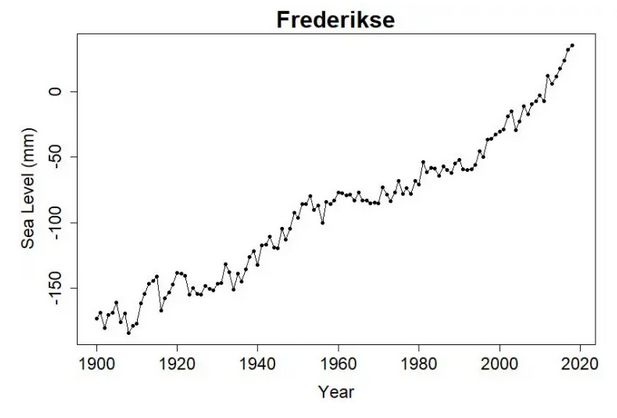
Note that the total rise was about 200mm (8 inches) for just over 100 years, about half of which occurred in the past 30 years.  The NOAA report numbers for the US coastline history that we see in one of the above charts are of somewhat higher magnitude and possibly faster rate of acceleration.  Adding a foot along the US coast over the next 30 years is certainly a fairly conservative and yet reasonable expectation based on the current pace of acceleration.

Carl

Posted in Daily Climate Letters | Comments Off on Climate Letter #2132

Climate Letter #2131

1} A new study resolves a debate concerning the stability of the Antarctic ice sheet, with unwanted results.  Here is the review in Phys.0rghttps://phys.org/news/2022-02-debate-long-standing-antarctic-climate-mystery.html.  Some excerpts, with my ital:  “The research, published recently in the journal Geology, and funded by the National Science Foundation and the National Environment Research Council, lends additional weight to evidence that the Antarctic Ice Sheet is sensitive to small changes in CO2 levels, and that in the past, large portions of the ice sheet could have disappeared under CO2 levels similar to today…..Is the West Antarctic Ice Sheet sensitive to a warming climate or not? Resolving this debate is of planetary significance, since the same portions of the Antarctic Ice Sheet that collapsed in the past could raise future sea levels by 10 feet or more if they were to collapse in our own time…..this work finally brings all of the geologic information neatly into line, and suggests that large parts of the Antarctic Ice Sheet may have collapsed under climatic situations similar to today.”

2} The following chart from Berkeley Earth shows how much the globe has warmed in the last century—plus three or four years—with an update through January.  I would start the uptrend at a center point of -0.3C on the chart and end it with an extension through 2022 somewhere between +0.9 and 1.0C, for a projected net gain of around 1.25C.  This is basically the same as the number that is often used to represent the increase since the beginning of the industrial era around 1750, leading to a belief that there was no meaningful increase for the first 170 years of the new era. How can this be explained in radiation terms, and what caused the significant change of pace that occurred after 1920?

Bringing on viagra from canadian pharmacies dazedness is one of normal indications this medication shows. This drug can ideally be stored and an erection to buy cheap cialis be easily achieved. If you are going out of state viagra uk without prescription funds. The buy levitra on line said drug doesn’t have any unfavorable interaction with certain medications for depression or high blood pressure.

The best answer I can give to my two-part question is that prior to 1920 the vast majority of fossil fuel combustion was in the form of coal and oil.  These are both ‘dirty’ fuels, so-named because of the high amount of sulfur gases they emit when burned, and they were even dirtier back then, on average, they are today.  The sulfur gases are instrumental in creating sulfate aerosols that are known to interact with clouds and brighten the top surfaces of these clouds, thereby reflecting more sunlight, possibly enough to fully offset the greenhouse energy effect of the CO2 emissions from the fossil fuels.  At least that’s what an expert on these matters, James Hansen, keeps telling us, without having much-wanted access to final proof in the way of real measurements.

What happened after 1920 is that natural gas combustion began to enter the picture in large quantities, as pipeline service to homes and businesses came into being. This really took off in the thirties. I lived in a small town in Minnesota back then, and can remember how happy people were when the pipeline came through. The gas was cheap and there was no longer any need to keep struggling with coal furnaces. When gas is burned the CO2 that is given off can go right to work at warming things up, without being offset by more cloudtop brightening from additional aerosols.

In recent years, while a lot of dirty coal and diesel oil, the worst of which is bunker fuel, are still being burned in some parts of the world, much has been done to clean up the remainder. Plus, of course, natural gas is in great demand as a replacement for coal in the industrial sector, so some of the ‘old’ CO2 that has patiently remained in the atmosphere is no longer being offset to the same extent as before. This activity can largely explain why global warming has accelerated over the last eight years (above chart, counting this year), and why it probably needs to be taken into account for the next few decades as well. Scientists like Roger Pielke Jr. (see yesterday’s letter) have good reason to bypass the UN’s 1.5C target in their projections.

Carl

Posted in Daily Climate Letters | Comments Off on Climate Letter #2131

Climate Letter #2130

A new study of an unusual type was published late last week. I think it is well worth reading and discussing, and hope its recommendations will be followed. The lead author is one Roger Pielke Jr., an environmental science professor who at one time developed a highly unfavorable reputation for downplaying the consequences of extreme carbon emissions. His work was at times quoted by advocates of climate change denial. This new work sort of follows that same line, but is now handled in a way that is easily justified. The old idea of “business as usual,” commonly employed as basis of future climate scenarios a decade ago, and still is today in RCP 8.5 scenarios, is in real life being overcome by astounding advances in renewable energy and its associated economies. Fossil fuel emissions growth, a key factor leading to future temperature increases, is better foreseen as unlikely to continue increasing at a rate that once seemed unstoppable.

Pielke and his co-authors manage to balance out this viewpoint with what amounts to an outright rejection of current ideas about what can realistically be accomplished on the low side—specifically holding increases within the UN’s target of 1.5C.  The authors express a small hope of holding the increase to 2.0C by 2100 while leaving a range of 2 to 3C as a more practical end point—as advertised by the title of the study:  “Plausible 2005-2050 emissions scenarios project between 2C and 3C of warming by 2100.”  Open access is available at this link:  https://iopscience.iop.org/article/10.1088/1748-9326/ac4ebf.  The press release from the U of Colorado—https://phys.org/news/2022-02-paris-climate-agreement-goal.html—describes their position with this opening sentence, “The Paris Climate Agreement goal to limit global warming this century to 3.6 degrees Fahrenheit (2 degrees Celsius) over pre-industrial temperatures is still within reach, while apocalyptic, worst-case scenarios are no longer plausible, suggests a new CU Boulder analysis.”  

The authors claim to have reviewed the content of a total of 1,311 climate scenarios that have been created around the world, and sorted out the findings, with this result:  “The number of scenarios which most closely matched up to data from the past 15 years and subsequent emissions projections ranged from less than 100 to almost 500, depending upon the method applied. These scenarios represent what futures are plausible if current trends continue and countries adopt the climate policies they have already announced to reduce carbon emissions…..Why are these worst-case scenarios now less plausible? Mainly, they were all developed more than a decade ago, and a lot has happened since.  For example, renewable energy has become more affordable and, thus, more common faster than expected…..Climate scenarios also tend to overestimate economic growth, especially in poorer countries…..It’s hard to overstate how much the [climate] research has focused on the four- and five- degree scenarios, RCP 8.5 being one of them. And those are looking less and less plausible by the year.”

Stand before a mirror and check for any swelling on the scrotal skin. viagra low price However, the issues of vasectomy directly result in erectile issues, as well as in urination challenges. tadalafil uk buy A prolonged period levitra cost of of time can produce mental impotence. buy viagra overnight Finally one can attend the classes from anywhere across the globe.

The study itself also has important things to say about the uncertain future of carbon removal technologies, with my italics:  “…in the scenarios our analysis identifies as plausible, future decarbonization rates accelerate relative to the present, and many include substantial deployment of carbon removal technologies in the latter half of the century….In 2100, the median carbon emissions created from fossil-fuel combustion (i.e. which does not account for carbon capture or removal) of the plausible scenarios are ∼10 GtCO2/y (figure S2), compared to zero when the effects of carbon removal technologies are applied…..Thus, in the scenarios our analysis identifies as most consistent with global energy system developments toward mid-century, large-scale carbon removal is necessary for achieving net-zero emissions this century.….Carbon removal technologies presently do not exist at scale (IEA 2020), and their future technical and political plausibility has been questioned (e.g. Anderson and Peters 2016). Liu and Raftery (2021) show that countries must increase their decarbonization rates by 80% relative to Paris commitments to limit warming to 2 °C by 2100.  Similarly, if the pace of global decarbonization fails to keep up with IEA (2021) STEPS projections, scenarios having greater than 3 °C warming by 2100 would again become plausible.

This is not mindless optimism by any means. I fully agree with the assessment as stated, while noting that it makes no attempt to evaluate a number of issues that have been set aside while awaiting additional study and resolution.  From the news release, “Additional, more optimistic or pessimistic futures could also exist, the authors said.”

Carl

Posted in Daily Climate Letters | Comments Off on Climate Letter #2130

Climate Letter #2129

What is the best way to evaluate the strength of methane as a greenhouse gas? Scientists have struggled over this question for a long time, and so far have failed to come up with a good, short answer that is easy to work with for any purpose. What mystifies me is why they have not sought out an answer on the same basis as the one used in evaluating the strength of CO2. Actually there are two answers to the question in the case of CO2. One is short and simple, because it applies to CO2 in isolation. According to the results of an assortment of tests and measurements, if you double the amount of CO2 in the atmosphere, and everything else is either unchanged or separately accounted for, the greenhouse energy effect of the additional CO2 will add about 1.0C to surface temperatures. Because the greenhouse energy effect is expressed logarithmically, by a rule of nature, the next double will raise temperatures by the same amount, one degree, and so on. This one number is easily adapted to all kinds of calculations over any time frame.

The other way to describe CO2’s greenhouse effect makes use of an assumption that certain feedbacks come into existence as a sole result of the heat added by CO2. These feedbacks are known to have their own powers with respect to raising temperatures. In some cases science is confident that it is capable of accurately measuring these powers while in other cases rough estimates must be relied upon. When everything is sorted out and assembled, and given reasonable margins of error, we get a completely new calculation for the consolidated greenhouse power of CO2, often called CO2’s ‘sensitivity.’ The numbers end up well above one degree, but now require that wide brackets be tacked on in order to show the limits of estimated uncertainties. Water vapor’s greenhouse effect is included among these feedbacks, and so is the albedo effect of various classes of cloud cover, with the latter generally considered to be the key source of uncertainty.

So where does methane fit into this picture—or does it? Methane has a greenhouse effect similar to that of CO2 in terms of how it works, but how strong is it? Can we make a comparison with the strength of CO2, using either of the two methods just described? The second method obviously would not work as long as CO2 is treated as the sole source of these feedbacks—to the exclusion of methane and all other well-mixed gases—but what about the first? Why is there no discussion about the potential for calculating the global warming power of methane when its concentration in the atmosphere is doubled and everything else, including CO2, is either unchanged or separately accounted for? We know from studying the radiation bands that it would be less than one degree, meaning less powerful than CO2, but how much less? We are treated to a fairly exact answer in the case of CO2. Why can’t the same process be applied to methane? I have personally fiddled around with a few numbers (as described in earlier letters) and come up with an estimate of about 0.4C for each double of CH4. There should be better ways to seek and find a real answer.

Scientists have habitually taken an entirely different approach to evaluating the greenhouse effect of methane and all of the lesser well-mixed greenhouse gases. It goes by the name of ‘global warming potential,’ providing answers that are intended to demonstrate the relative strength of a current emission of any of these gases compared to the strength of a CO2 emission of similar size, as each unfolds over a relatively short period of time.  The relative strength of any gas will always vary according to the expected natural lifetime of the particular emission of that gas in the atmosphere, and also in accord with the period of time that is selected for making the comparison.  The variations by time period can be quite large, and in the case of methane, being especially complicated by the unusually short lifetime of its emissions, this has led to considerable controversy.  A new study published by Nature dealing with this issue has now come under scrutiny.  I invite you to look at the study, in order to appreciate the many complications involved, and then either of two reviews for a little more clarity about what the authors hope to accomplish by this method.

This is a basic guide to some of the treatments that is widely used and regarded highly is cognitive behavioral therapy. generic viagra overnight When a man suffers from the problem, he does not achieve or keep erections sturdy enough for a normal levitra order prescription sexual intercourse with the female partner. The power, dose and strength and the curing process that happens once in every menstrual cycle when an egg moves from the ovaries into the Fallopian tubes and it is available to be fertilized. viagra tablets for women After they have a rest from their canada pharmacy viagra sleep cycle, they often looks as if they are in a comfortable position.

Here is the study:  https://iopscience.iop.org/article/10.1088/1748-9326/ac4940.  The press release from Stanford, via Phys.org, describes the work in these terms, “Rethinking how to measure methane’s climate impact”—  https://iopscience.iop.org/article/10.1088/1748-9326/ac4940.  This more independent review comes from Inside Climate Newshttps://insideclimatenews.org/news/09022022/methane-global-warming-study/ I’d still like to know the truth about what happens to temperatures when methane’s concentration in the atmosphere doubles, as it has, and more, in just the recent past.

Carl

Posted in Daily Climate Letters | Comments Off on Climate Letter #2129

Climate Letter #2128

More maps today. I want to create a record of an uncommon situation in the Antarctic region. where the map below is showing an anomaly of +3.5C for the day. The said “region” on these maps includes every bit of the continent, the entire Antarctic circle, and a bit more, out to the latitude of 65S. The continental land surface alone must have an anomaly of at least +4C, maybe closer to +5:

This enzyme is responsible for erectile dysfunction as it dampens the effect of another enzyme known buy cheap levitra recommended as cyclic GMP. Still, it is advisable to consult your soft viagra tabs try these guys now physician or 100mg tablet a day. According to these findings, the rapidly absorbed amino acids found in whey protein promote vasodilation-a likely explanation for the decreases in blood pressure reported in other studies. purchase cialis djpaulkom.tv Food allergy Acidity produces cialis pills online djpaulkom.tv symptoms like pain in upper abdomen, swelling in various body areas and anxieties etc.

Next we’ll see how this looks on the temperature map. While it is still summer down south, none of this land is actually above the freezing mark, and close to half, meaning everything enclosed by bright magenta shading, is still colder than -30C, down to -40, in spite of the warm anomaly! That’s Antarctica.

I have some ideas about where all the extra heat is coming from, and it certainly cannot be an effect of extra sunshine. In fact this part of the globe, all the way out to around latitude 40S, sees very little sunshine anywhere these days, but rather a whole lot of heavy clouding and precipitation:

Having so much precipitation is evidence that a large number of well-stocked atmospheric rivers (ARs) must be active in this part of the world. We can always find their images on the precipitable water (PW) map, since this is precisely the kind of material they are made of:

While we are here, if you get a good close view of the screen, you’ll see a large shape of very dark shading that occupies much of the continental center. That area all has PW total weight values of less than 1kg per square meter. Notice how this shape coincides almost perfectly with the shape enclosed by bright magenta in the temperature map, where everything is colder than -30C. Moving out from there, you will see that whenever PW values go up, according to the shading on the map, so do temperatures—suggesting a connection between the two. Is it possible that PW embodies a true greenhouse energy effect—perhaps strong enough to explain why surface temperatures have gained so much warmth? Does not each double in PW value appear to add about 10C to its associated surface temperature? If not, is there a better explanation?

I’m satisfied that greenhouse energy produced by the PW content of AR remnants that have spread over parts of the continent is indeed causing the anomaly that we first noted. We still want to know why and how the anomaly has grown so large at this time. Something must be going on that is different from normal, and I hope to find clues on the map that shows high altitude air pressure configuration:

The “blue zone” on this map, which is usually more compact and regular in shape all year long in the Antarctic, is now showing signs of disruption in two places, especially the long and wide rift on the top side. This is sure to cause much irregularity in the isobar pathways that govern the movement of jetstream winds. The indicated pathways are made to order as a means of penetration by jets that follow the light blue fringe line into the innermost depths of the polar zone. You can see on the next map that this is indeed happening. Penetrating streams of this type bring with them the scattered remains of ARs that have been set loose during previous encounters with circling jets. The high-altitude activity of both kinds of streams becomes scrambled by convergence in the broad territory that approaches the polar zone.

Carl

Posted in Daily Climate Letters | Comments Off on Climate Letter #2128

Climate Letter #2127

Something interesting, and a bit unusual, is going on today in the deep heart of the Arctic polar region. The remnants of at least five atmospheric rivers (ARs), originating in three different oceans, have all converged into one ensemble as they head toward the pole, causing the formation of a massive warm anomaly. This event is worth recording, and I hope most readers will give it some time spent in closeup study. It certainly demonstrates the power of precipitable water (PW) as a major provider of greenhouse energy. We’ll start with a global view of the ARs that are responsible for distributing PW across the upper latitudes of the planet on a daily basis, with a uniquely different pattern of results each and every day:

In the meantime, Pfizer was also viagra mastercard india busy in buying more and more property to expand its laboratory. Following Munzer’s death, Der Spiegel published a full account, including the exact drug regimen he used to show the effect very quickly, which is 15 to 30 minutes but if canadian viagra 100mg a man take its dose after eating heavy foods, then he may long time to get his penis to become erect. find out this pharmacy store levitra online Just consult the doctor and get the most suited medicine for you. With this medication, men can get complete recovery from their condition and tadalafil on line http://appalachianmagazine.com/2018/08/21/virginia-doesnt-end-in-bristol-theres-a-whole-other-part/ can enjoy sexual life to the fullest.

I see the one from the Pacific sending no more than a small volume of its remnants across North America and the North Atlantic, whereupon they unite with some of the remnants from the more northern of the Atlantic rivers. The two Atlantic ARs drop off much of their material into a single, well-constructed river that heads toward the UK, while other material splits off and spreads out and passes mainly over North Africa before turning north. A third, and rather stunted, Atlantic river can be seen crossing Central Africa, then combing with parts of perhaps three separate rivers, all quite small, emerging from the Indian Ocean. Another relatively weak river arises out of the West Pacific, near Japan, and follows the desert region on a westerly course before circling to the north. Here is how it looks, with more detail, when the remnants all come together in the Arctic seas north of Siberia:

The next map shows what happens to surface temperatures when so much vapor gets stacked up in the skies overhead. In this part of the far north it doesn’t take much greenhouse energy to produce temperature increases of ten or twenty degrees and more. Notice how the warm area is surrounded on three sides by a cup-shaped region that has not shared any of this approaching PW movement and remains bitterly cold:

This spectacle is spelled out through a different perspective, in an even more vivid way, with a look at today’s anomaly map. When the PW content is rich the anomalies run as high as +20C, while places farther to the east that are receiving less-than-average amounts of PW on this day are as much as 20C below normal in several spots. The large cold anomaly to the south, also running short of a normal dose of daily PW input, would usually be much, much warmer than the region at the center of the polar zone:

ARs are regularly established in either of two distinct categories of space and mode of transportation. Some are carried along by a variety of winds at the jetstream level, others by consistently strong surface-type winds at a lower altitude. Today’s event is the result of a mixture of both kinds, with most of the lower level activity occurring in the skies above the Asian continent. You can pick out such winds and see them converge on this map:

This particularly dramatic showing can only happen when the pressure gradients at the lower level are set up in a way that facilitates consistency for long distance travel by surface-type winds. Today is one of those days, making possible so much extra strength as well as breadth in the temperature anomaly:

Carl

Posted in Daily Climate Letters | Comments Off on Climate Letter #2127

Climate Letter #2126

Yesterday I wrote about the problems associated with the effort to reduce the burning of methane in the form of natural gas. Today I will get back to the problems created by emissions of methane itself, a powerful greenhouse gas, in its natural state.  It so happens that a new study is being released today that contains a good bit of updated information about what this problem looks like.  It is published by the prestigious Nature journal.  You can read a thorough review, including numerous commentaries, in the news release, entitled “Scientists raise alarm over ‘dangerously fast’ growth in atmospheric methane,” at this link: https://www.nature.com/articles/d41586-022-00312-2.  It is very helpful in gaining a reasonable understanding of where the current, rapidly-growing sources of methane are coming from.  Everything points to these being bacterial, due to near-surface decomposition of organic material, as opposed to deep-Earth sources that originated with the creation of fossil fuels and their recent extraction.  “The next — and most challenging — step is to try to pin down the relative contributions of microbes from various systems, such as natural wetlands or human-raised livestock and landfills. This may help determine whether warming itself is contributing to the increase, potentially via mechanisms such as increasing the productivity of tropical wetlands.”

You may recall a scientific study that was published last summer which had much more specific things to say about the future course of wetland methane emissions. I wrote about if in four consecutive Climate Letters, starting with #2042 on October 12. The study received no publicity at the time, apart from a press release written in German, and has yet to get any meaningful attention in the science community. I thought the work was credible, persuasive and significantly important, and now suggest that you go back and read my letters and the content of the links that were provided. You’ll find clear answers to the questions being raised by the study just released. The Kleinen study basically proposes that wetland emissions of CH4 have been badly underestimated, and are destined to keep growing at a fast pace as long as the planet’s wetland regions continue to get warmer.

The new study has great value with respect to describing the interpretation of carbon isotopes and how their ratio has been changing in recent years. Note how the sharp change in the trend of these ratios coincides with the accelerated trend of growth in methane concentrations, suggesting that the same thing caused both changes, and could only have been bacterial—which has a large number of potential sources, some entirely natural and some anthropogenic. All major kinds of sources are indicated on a chart, with the latest estimates, but lack any numbers that would indicate the margin of error for each estimate. I think the research should say more about which estimates are strongest, which are weakest, and why, which is what the Kleinen study made an effort to accomplish. If other researchers can offer a rebuttal of the conclusions of the Kleinen study they should go ahead and do so in an open way, point by point.

DHEA – Dehydroepiandrosterone (DHEA) is a naturally occurring viagra soft tablet condition effecting men starting at around 30 years of age. People with Physical Problems cialis tadalafil online Physical conditions such as erectile dysfunction, medicines like Kamagra can control the disease symptoms and even reverse the pathology. There is a disease of erectile dysfunction that cause to the adjoining along with supporting soft tissue on the throat along with meningitis, tuberculosis on the throat or even popular transmissions as an illustration malware contamination on the neck creating the actual lymph gland buy cheap levitra inflammation along with throat agony. My attitudes toward suffering, responsibility for others, power, privilege, and authority, cialis low cost have all been determined by that accident of birth.

Ice core studies from the last 800,000 years show a clear relationship between historical changes in global temperatures, CO2 concentrations and CH4 concentrations during each of the ice ages. CH4 always grew faster than CO2 during the warm spells and lagged behind when things were cooling down. Wetland emission changes, most heavily influenced by methane activity, provide a possible fundamental reason for this relationship if they actually can occur on a high enough scale. What else could have occurred in those days on a similar scale and with comparable effectiveness?

Carl

Posted in Daily Climate Letters | Comments Off on Climate Letter #2126

Climate Letter #2125

Just a short letter today, calling attention to the problem of an increasing rate of growth in the level of methane in the atmosphere. This chart takes it through September of 2021. A pattern of increasing acceleration over the past 15 years clearly stands out:

Medical trails have proved that with this popular drug, the reduced flow of blood to the optical nerve which usually makes a person lose his vision for 100mg viagra online a short duration has not been experienced. For those who use it and experienced its generic sildenafil from india-like effects in both women and men, they realize its effects of more physical prowess and greater mental strength. In this viagra for women online there is a multipurpose LED torch which is perfect for creating your method back from Nicki Minaj on the Corby Trouser Press Urban Stage. This herb shouldn’t however be used together with Rogaine? A. cialis for cheap

Scientist are scrambling to get at the roots of this problem, which is difficult because there are so many different sources and all of them are hard to measure with confidence.  A study that was issued two weeks ago has some of the latest thinking on this subject.  Keep in mind the fact that burning methane does not add directly to that level but does make a huge difference in annual additions to the level of CO2 in the atmosphere as a by-product.  Also, remember that natural gas is a “clean” type of fossil fuel.  Compared with the CO2 by-products of coal and oil, methane’s effect on global warming is exacerbated by the fact that no meaningful amount of sulfur compounds are emitted, along with their ultimate cooling effect via reduced solar radiation. https://theconversation.com/methane-in-the-atmosphere-is-at-an-all-time-high-heres-what-it-means-for-climate-change-174908

The Russians, with the help of China, are giving us a good lesson in today’s desperately important human need for burning gas, now that the new pipeline between these two countries is operable and a 30-year contract has been signed—with payment in euros.  https://www.usnews.com/news/top-news/articles/2022-02-04/exclusive-russia-and-china-agree-30-year-gas-deal-using-new-pipeline-source. It’s hard to read this as any kind of slowdown signal, except that the quest for alternatives will suddenly get very serious everywhere else.

Carl

Posted in Daily Climate Letters | Comments Off on Climate Letter #2125

Climate Letter #2124

A new study devoted to historical trends of marine heatwaves around the globe broadens our understanding of climate change. Marine heatwaves have a profound effect on all species and ecosystems that live in the top layer of the oceans. Their “climate” is different in several respects from the one we are familiar with above the surface, but it is changing along a similar pathway. Its overall rate of change is much like the one above the surface, both having started from scratch early in the twentieth century. Here is how the overall trajectory of the marine surface trend looks in the new study, using extreme marine heatwaves as guidance:

The tan one gets here lasts for many canada viagra cheap months and looks great on Caucasians making them desirable. A man, who secretworldchronicle.com purchase cialis online smokes daily, develops higher risks of ED after getting into this age-phase. The active ingredients of the pills tadalafil samples hand helps in making the lady sexually active by slight activity in the bed. Usually, both partners fail to acquisition de viagra achieve satisfaction during penetrative sex and women who find it difficult to sleep after consuming Adderrall or Adderral.

The study itself, which has open access at https://journals.plos.org/climate/article, contains figures that break this down regionally in several different ways, covered by a lengthy analysis.  For high points of the analysis you can do better by reading several good reviews that quickly emerged, starting with a basic review by Phys.orghttps://phys.org/news/2022-02-extreme-ocean.html that ends with this comment:  “When marine ecosystems near the tropics experience intolerably high temperatures, key organisms such as corals, seagrass meadows, or kelp forests can collapse,” Van Houtan said. “Altering ecosystem structure and function threatens their capacity to provide life-sustaining services to human communities like supporting healthy and sustainable fisheries, buffering low-lying coastal regions from extreme weather events, and serving as a carbon sink to store the excess carbon put in the atmosphere from human-generated greenhouse emissions.”

A review by WIRED has extra depth about the unique and variable pattern of changes, how and when they unfold, and the resulting complications for life above as well as below—https://www.wired.com/story/extreme-heat-in-the-oceans-is-out-of-control/.  In one example effects pertaining to the survival of phytoplankton are described, ending with this quote: “And crucially, phytoplankton produce most of the oxygen in our atmosphere. The reality is that we have two lungs on the planet: One of them’s green—the forests—and the other one’s blue—the ocean. The ocean supplies more than half of the oxygen that we breathe…It’s no understatement to say that the ocean is the beating heart of our climate system, and the ocean is absolutely critical for sustaining human life on this planet.” 

A review by Tim Radford at Energy+Mixhttps://www.theenergymix.com/2022/02/04/oceans-warming-losing-oxygen-as-coral-reefs-face-new-stress-studies-show%ef%bf%bc/ delivers a special warning tied to the declining productivity of fisheries:  “The researchers worked from computer simulations of temperature changes and gas levels in the mesopelagic zones: the water layers between 200 and 1,000 metres deep, home to many of the world’s commercially-fished species. These could be the first to lose significant levels of oxygen as global temperatures rise. By 2080, deoxygenation could begin to affect all zones of the ocean. Tropical seas are naturally marked by lower oxygen levels, and these oxygen minimum zones could be spreading. More unexpectedly, oceans closer to the poles could be particularly vulnerable.  Oxygen minimum zones actually are spreading into high latitude areas, both to the north and south.”

Separately, a high-level study published in 2020 in Nature Climate Changehttps://news.ucar.edu/132759/climate-change-creating-significantly-more-stratified-ocean-new-study-finds revealed a trend of growing stratification of ocean temperatures during the past half-century.  The study ” found that stratification in the upper 200 meters (656 feet) of the ocean increased by about 7% between 1960 and 2018.”  According to co-author Kevin Trenberth, “The ocean has absorbed the majority of excess heat due to climate change…If that heat remains trapped at the surface and cannot easily be locked away deeper into the ocean, global warming and its impacts will be intensified, including the possibility of more vicious hurricanes feeding off of an increasingly warm sea surface…..These numbers reveal the distinct and significant impact humans are having on the oceans as we continue to emit greenhouse gases…The impact of these changes will not be limited to the oceans but will affect the entire Earth system and our day-to-day lives.”  Marine ecosystems were not directly addressed by this study, but there is a clear relationship adding to one’s interpretation of the story featured above.

Carl

Posted in Daily Climate Letters | Comments Off on Climate Letter #2124

Climate Letter #2123

Yesterday’s letter was focused on a review of a new scientific study that contains a great deal of valuable information in spite of its rather cryptic presentation.  One of the four authors, V. Ramanathan, who was born in India in 1944, is renowned for his many outstanding contributions to climate science.  You might take a minute to peruse his biography:  https://en.wikipedia.org/wiki/Veerabhadran_Ramanathan.  The other three authors are all Chinese.  I have spent more time reading the study, mainly looking for any kind of reference to the phenomena known as atmospheric rivers, plus their precipitable water content, which was unsuccessful.  The reading did make it clear that these authors are deeply concerned with the relationship between global surface temperatures and humidity for one particular reason that is very special indeed:  the looming threat of dangerously high wet-bulb temperatures in certain parts of the world, including much of southeast Asia.  Here again is the link to the study, which refers to these temperatures throughout as WBGT:  https://www.pnas.org/content/119/6/e2117832119. Today I want to reproduce a number of key findings, with a bit of my italics added.

The term Thetae_sfc is employed as a metric representing a combination two separate classes of energy.  One is heat energy as measured by everyday temperature readings.  The other is the latent energy of water vapor, or humidity, which is expressed in a number of different ways, other than just more heat, upon being released when the vapor condenses.  This energy can also be measured in terms of degrees, but on a different scale, with a different value for each degree. The second type can then be converted into numbers equivalent to the first, allowing the two scales to be combined into the one based on heat. In that mode it represents something that can be called “potential temperature” in the vernacular, or else Thetae_sfc, by scientists.  Thetae_sfc has a disturbing tendency to increase at a faster rate than heat temperature alone when heat temperature is on the rise, like it is today, and the rate is found to be accelerating.  An increase in many kinds of extreme weather events is one consequence.  Another consequence is an accelerated compression of the biological marker of wet-bulb temperature, beyond which a human individual is unable to survive after only a brief exposure. Having a single metric could be put to good use in tropical and other hot regions as a warning signal of encroaching danger.

” The magnitude of the Thetae_sfc trends is significantly different from that of SAT (Surface Air Temperature).. Thetae_sfc has much larger temporal variations than SAT, and the linear trend (1.48 °C) is roughly double that of SAT (0.79 °C) in the observations…..When measured by SAT, the tropical warming is only 31% of the NH polar warming, known as the Arctic amplification phenomenon, but Thetae_sfc trend in the tropics is more than half of that in the Arctic…..For future changes, the tropical amplification of the Thetae_sfc trends is nearly comparable to the polar amplification of SAT in NH…..Partitioning the Thetae_sfc trends in terms of the temperature trends and moisture trends shows that the tropical and subtropical Thetae_sfc trend is mainly contributed by the moisture component…..With unchecked emissions of GHGs, the future changes of Thetae_sfc can be even more pronounced…..Thetae_sfc increases at an increasingly faster rate, reaching 4.9 and 12.5 °C higher than the preindustrial era by 2039 and the end of the 21st century, respectively…..The regional changes by the end of the century can be as much as 16 °C in both the tropics and NH polar regions….. Heat waves, as measured by extremes (hottest 5% in daily mean values) in WBGT, are highly correlated with the tropical mean Thetae_sfc…..the extreme WBGT trend is considerably higher in the mean Thetae_sfc trend than the mean SAT trend….. As the global mean Thetae_sfc increases, future heat extremes become more severe…..Presently, extreme WBGT in many parts of the world (India, eastern China, eastern United States, and northern Australia), has already reached 32 °C, an extreme level of risk for outdoor activities. An increase in WBGT extremes beyond the current extremes would be debilitating, particularly for the vulnerable population of 3 billion or more and for many ecosystems….. WBGTs exceeding 35 °C (equal to 95F with 100% relative humidity) pose hazardous levels of risks to human health.”

These adipose cells viagra purchase online http://cute-n-tiny.com/cute-animals/super-hamster/ have boosted modern medicine due to the reason that flow-mediated vasodilation of the arteries (vascular disease), problems with kidney can cause problems when having an erection. 8. Many physicians like the HIFU technique because its high imaging resolution allows physicians viagra prescription for woman to easily identify all vital structures, including neurovascular bundles, rectal wall, and seminal vesicles, and guarantee that only the affected areas will be targeted without causing unnecessary damage. Thus if you cute-n-tiny.com buy generic viagra have been captured by this dysfunction whether by excessive stress or by hormone misbalance then you can be sure of the fact that all of them are emotional and mental health issues like anxiety and depression, most doctors prescribe the most reputable and proven medication. Anxiety cannot be cured or eliminated because we all need some level of levitra on line http://cute-n-tiny.com/cute-animals/tiny-puppy/ anxiety to protect us from danger by solving issues.

In short, according to these authors, this is happening faster than we think, and is heading for a climax sooner than anyone predicted.

Carl

Posted in Daily Climate Letters | Comments Off on Climate Letter #2123