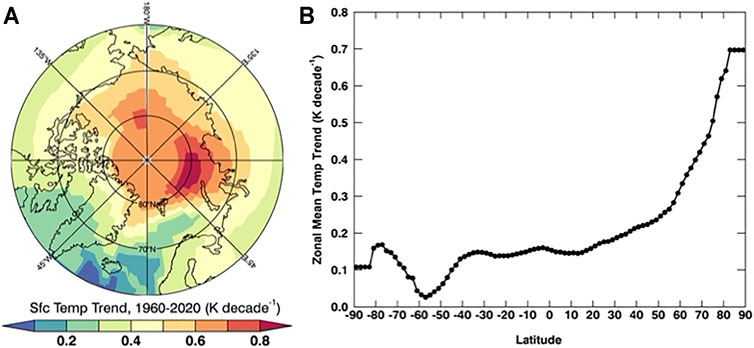
My letter two days ago (CL#2137) was devoted to a review based on a definitive new report about Arctic Amplification (AA). This is a scientific phenomenon of great scientific interest because of its grossly exaggerated effect on the average global temperature increases in recent decades of the industrial era. Much of the amplification effect has occurred during the time of the remarkable temperature uptrend that began in the mid 1970s and is still going. Look again at these two charts and you’ll see that the area north of 65N has gained far more heat than any other part of the globe since 1960. Every scientist wants to know why. A number of different reasons have been agreed upon, but there is also a common recognition that substantial uncertainties remain. As the report said, “Giving Arctic climate sensitivity a high priority ensures the rapid integration of knowledge into climate models and will accelerate the reduction in Arctic climate projection uncertainty.”
Today a new report has been published by Nature communications that highlights the role of the sea ice albedo feedback in determining Arctic climate sensitivity. The authors describe how models show that the rate of AA is notably high during times of steadily diminishing sea ice and less high during times when sea ice is stable. The models were able to project the same relationship into the future with reasonable credibility. Once the melting stops, so will the rate of amplification. But that is not the whole story. From the Abstract we read, “Our results indicate that climate change mitigation may have a side effect because Arctic warming persists even if the global warming is stabilized.” The study has open access at https://www.nature.com/articles/s43247-022-00354-4#Sec1.
Of further interest, the Discussion section concludes with this statement: “Although the CO2 forcing is dominant for global warming in all SSP {shared socioeconomic pathways} scenarios…an assessment of the degree to which other radiative forcings’ impact on AA will remain for future works.” The Introduction has this to say with respect to a broader context of reasons for the unusual warming: “The mechanism for AA has been explained well in the literature: temperature feedbacks (Planck response and lapse rate feedback), longwave feedback associated with polar clouds and water vapor, changes in the poleward heat transport by the atmosphere and ocean, and the ice-albedo feedback together warming the Arctic region preferentially in response to the increase in greenhouse gases.” I was especially pleased to see the mention of water vapor and poleward heat transport by the atmosphere, a theme that has been given considerable attention in previous climate letters.
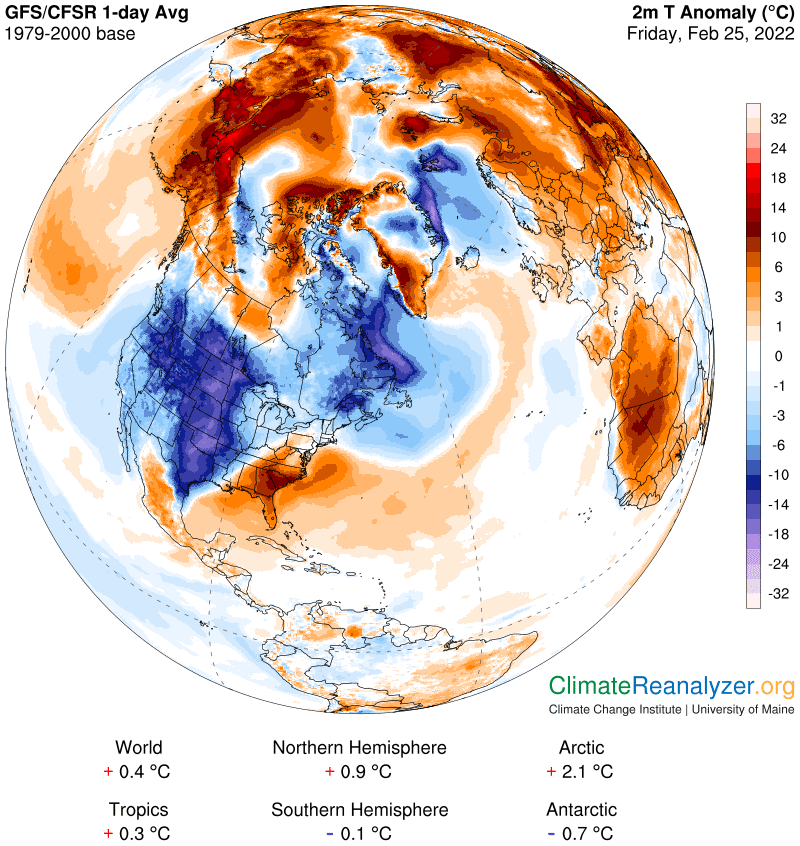
In order for AA to exist and be recognized there must be many individual days that are productive of an unusual amount of warming, the effects of which keep adding up over the time period being considered. Those days should not fail to make an appearance on the Anomaly maps that I often reproduce and write about. Today is one such day, showing an Arctic anomaly of 2.1C that is five times greater than the entire global anomaly for the day. Notice how this 2.1C anomaly is the net result of a mixture of hot and cold anomalies over different parts of the region. The hot ones had to more than offset the chilling effect of the cold ones. Moreover, there had to be real reasons for every one of the differences to exist in the first place.
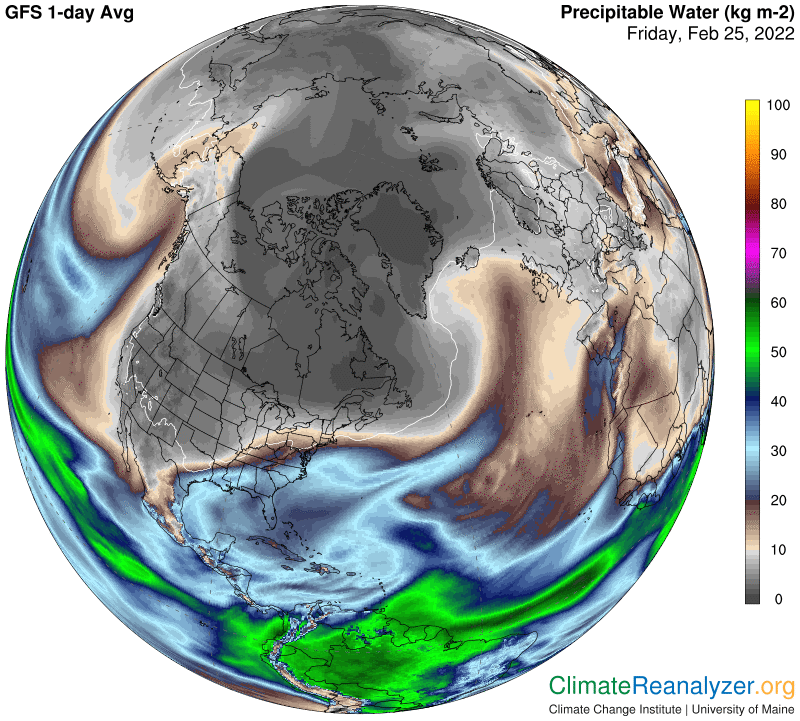
One good reason for the differences can be found on the Precipitable Water (PW) map covering the same region on the same 24-hour day. You can see images of atmospheric rivers unloading final remnants of their PW content in a manner that spreads the PW in different densities over different parts of the Arctic region. The highest densities can be seen consistently matching up with areas having the warmest temperature anomalies. Conversely, low densities match well with cold-type anomalies. Go ahead and scrutinize them, all of them, or at least the big ones.
Wouldn’t it be interesting if this same kind of relationship held true every day of the year, including the net coldest days in the region as well as the warmest ones? If so, and the results for all those days were added up, would not the accumulation of data be likely to send some kind of message about a principal cause of AA? Would not such information have potential value to science as a way of closing the uncertainty gap? This sounds like a good project for the Climate Letter.
Carl