An interesting panorama of anomalies today in North America. Hardly any location is either perfectly normal or even close to normal. Huge swathes of territory are colder than 10C below normal and equally huge swathes are 8C or more above normal. The visible part of the other hemisphere, meanwhile, is nearly all hot. Let’s have a look:
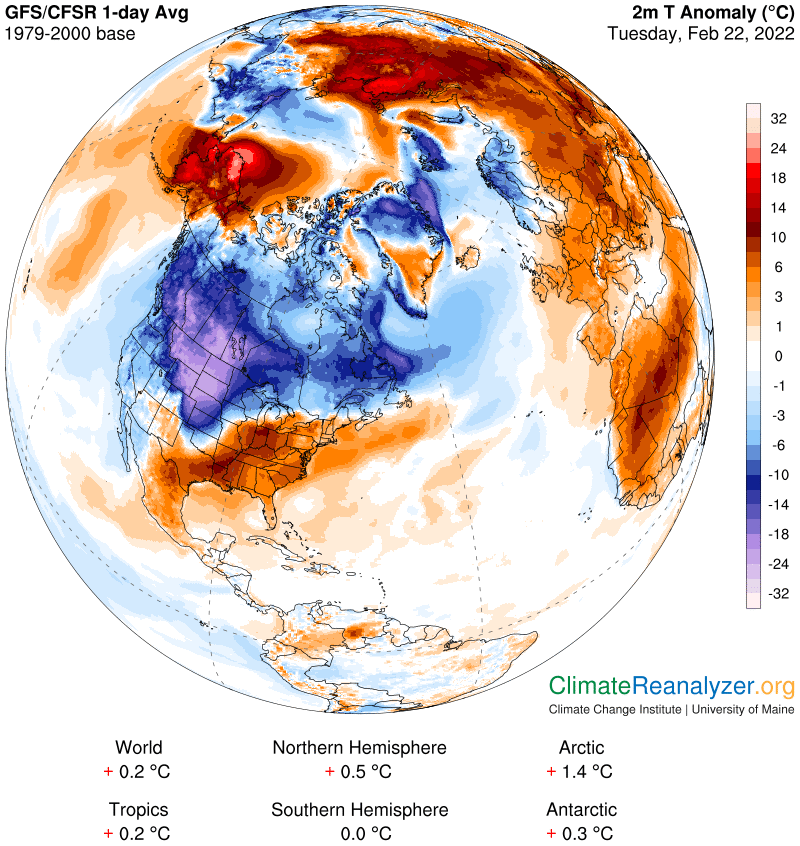
With lots of magnification you can find spots on the North Coast of Alaska as warm as 25C (45F) above normal and others in south central Canada at minus 25C. More than half of South Dakota is not much better, in the -21 to -24C bracket. As we see on the next map, average temperatures for the day are always interesting in a situation like this:
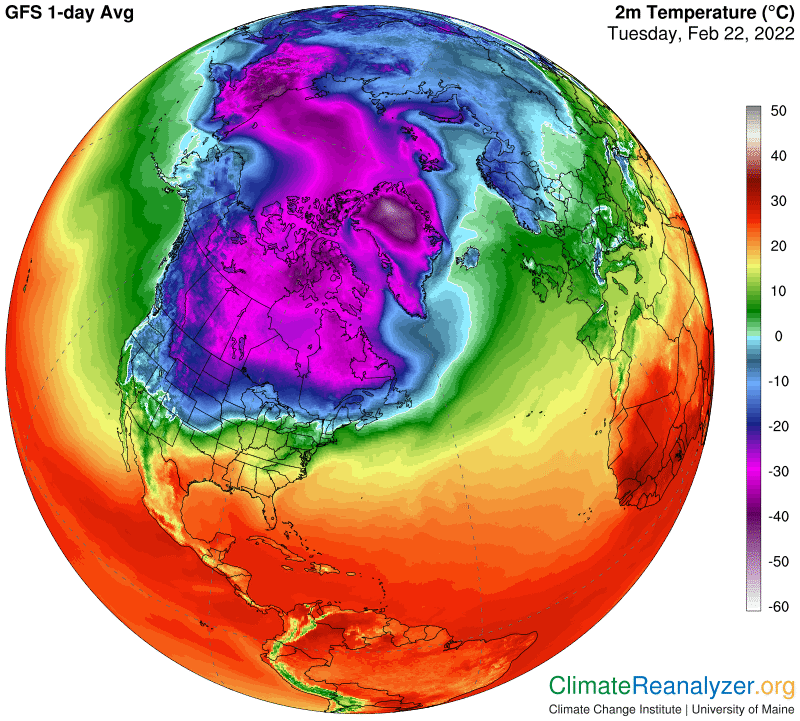
Northern Alaska at -10C is downright balmy compared with the Dakotas, both of which are running around -25C and lower—a difference of about 27F in favor of the far north. Minus 30C and lower is very common across southern Canada, quite similar to a good part of the polar zone. There is always an explanation for so much strange behavior, and the best place to start the search, as usual, is with the Precipitable Water (PW) map:
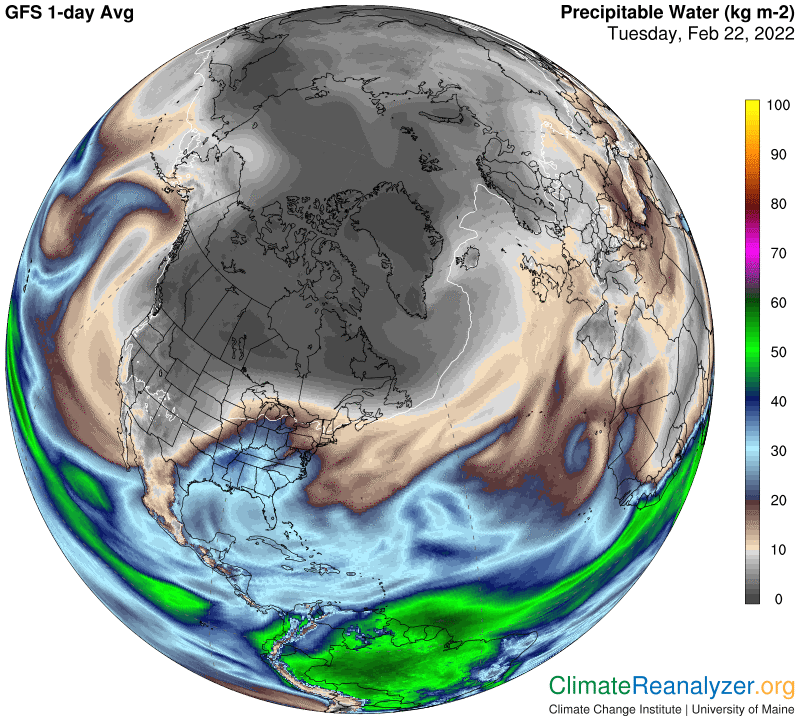
Practically all of the really cold zone over much of the continent is shaded in the two darkest tones of gray, meaning less than 2 kg. This diminishes their accuracy measurements for purposes of logarithmic comparisons but the association of darkest gray shading and the coldest of real temperatures is one that never fails. The most interesting feature on this map is responsible for the warm anomaly centered around Alaska and extending well into the Arctic Ocean. Two atmospheric rivers (ARs) are seen as they come off the Pacific Ocean and nearly converge, thrusting much of their PW content over land and ice beyond the coast. The weight of this content far exceeds the normal weight of PW in that region on most days, when the skies overhead are barren. (Every doubling of PW’s kg of weight adds 10C to temperatures.)
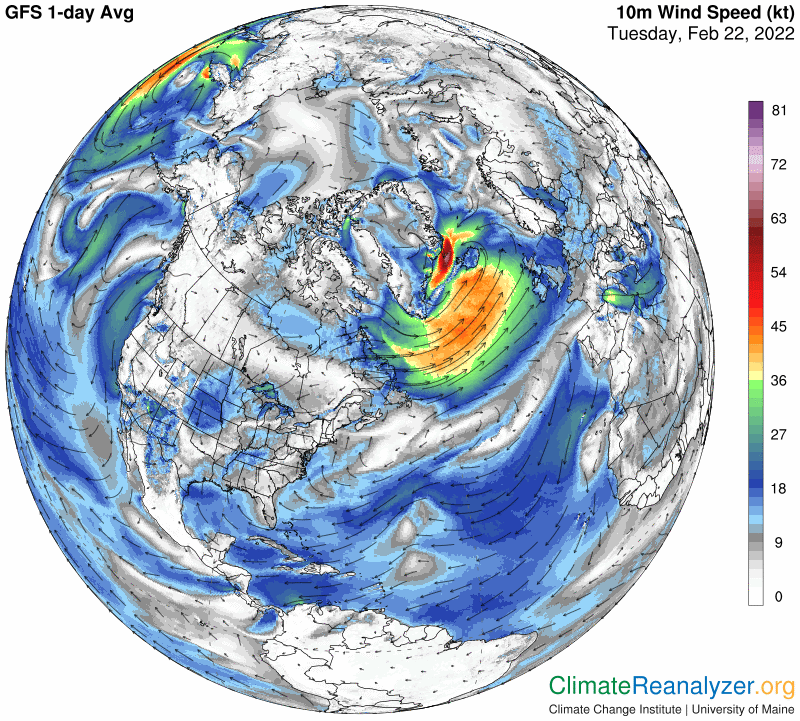
The pattern of jetstream wind activity on this day has a significant hand in the way PW is being carried and distributed. Jet streams moving north from tropical waters are bringing along rivers of moisture that is then dumped off when the wind direction forms a loop and heads back toward the south, now quite dry. The southward moving winds tend to seal off the entire region above their more northerly edge, keeping that region much drier than normal and thus colder. This map offers an illustration:
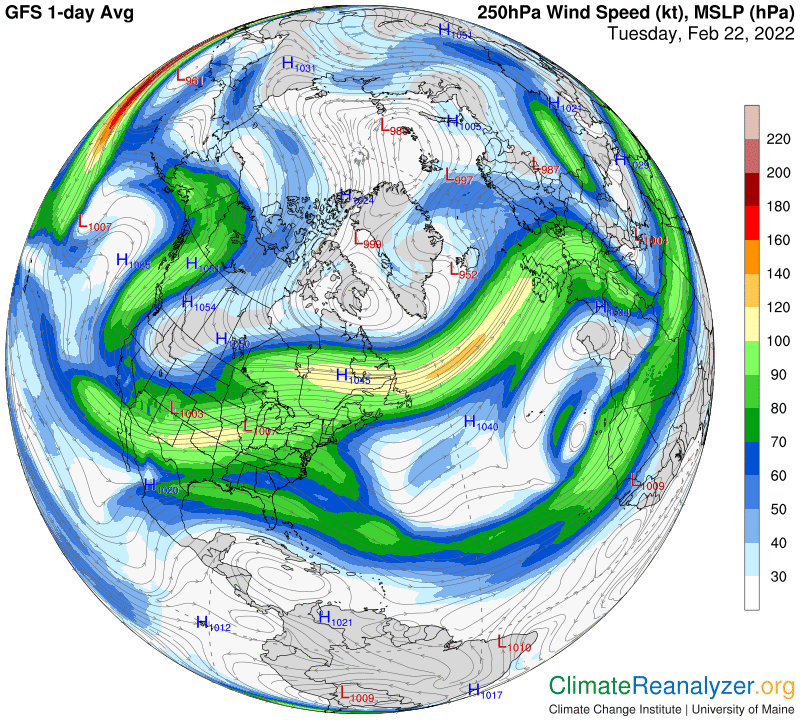
The warm anomaly in the southeastern part of the US is not affected either way by jetstream winds. This region lies within the path of a broad AR that is transporting copious amount of PW via lower level surface winds approaching from ocean and sea waters east of the Gulf. Another map is needed to show the pathways and intensity of these winds:
Carl