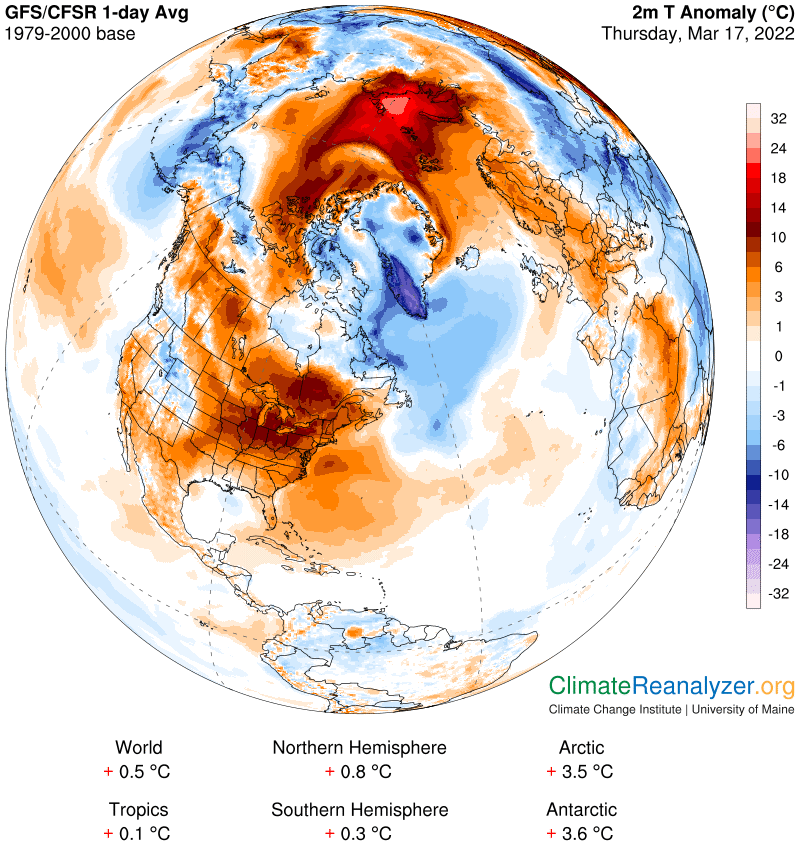
The Arctic is just as warm today as it was yesterday, +3.5C above the 1990-2000 baseline average. (Add about one degree for a late 19th century baseline.) I’ll be showing the relevant maps below, with a few comments, but first, I’d like you to compare my analysis of the warming to that of the scientific community, as reported in the Washington Post via Peter Sinclair’s website: https://climatecrocks.com/2022/03/16/temperature-spikes-in-arctic/. The story is introduced with a sentence that immediately stimulated my interest—“Possible new mechanism for warming acceleration in Arctic, – Atmospheric River injecting large volumes of warmth and moisture.” A “new” mechanism means new to science, in terms of placing a significant amount of the burden on atmospheric rivers (ARs) for the first time, at least at this wintry time of year. You can read the whole story to learn how ARs accomplish this feat under this new way of thinking. There is no mention at all about precipitable water (PW), which the incoming ARs are made from, having a greenhouse effect capable of doing the warming. Oh, well.
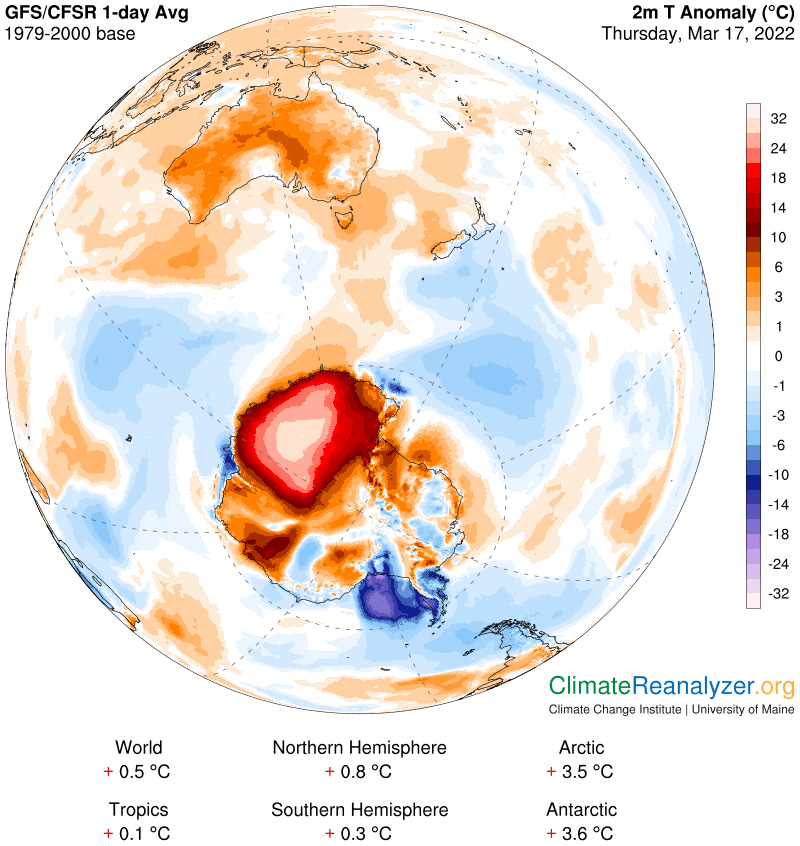
The Arctic anomaly is actually not the biggest story today. For the biggest we have to go down to the other pole, where Antarctica is now beating the Arctic with an anomaly of +3.6C. That’s up from 2.0 yesterday and minus-0.8 just three days ago! Things can indeed change in a hurry in the polar regions. The Antarctic maps will tell you why today is so special, and I will produce them below, but the Arctic must come first. The reasons behind the anomaly are basically the same as yesterday, except that all the forces have shifted positions in the usual counter-clockwise direction. Please notice how the shoreline parts of northern Siberia plus Europe have a warm anomaly on the western half and a cold one on the east, plus Alaska:
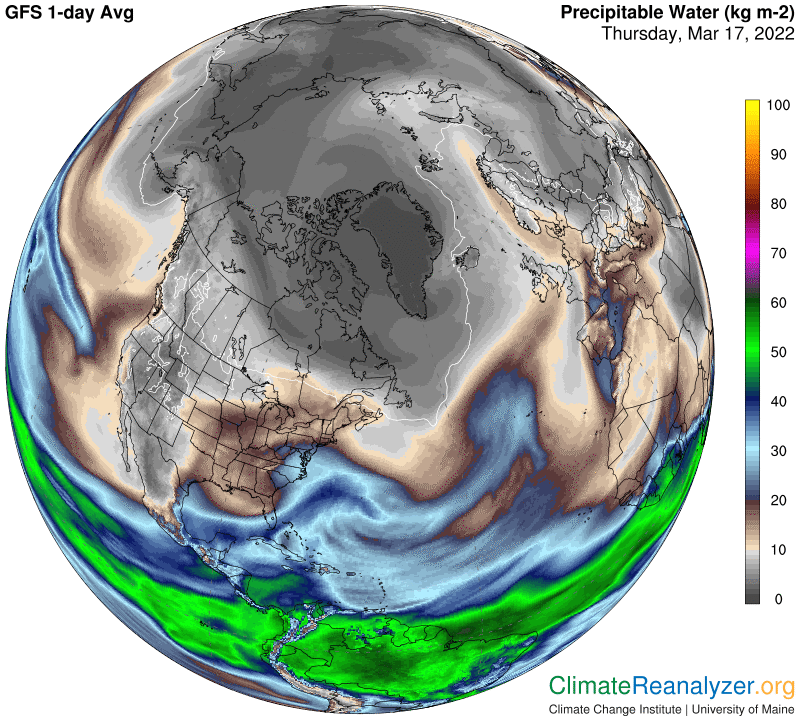
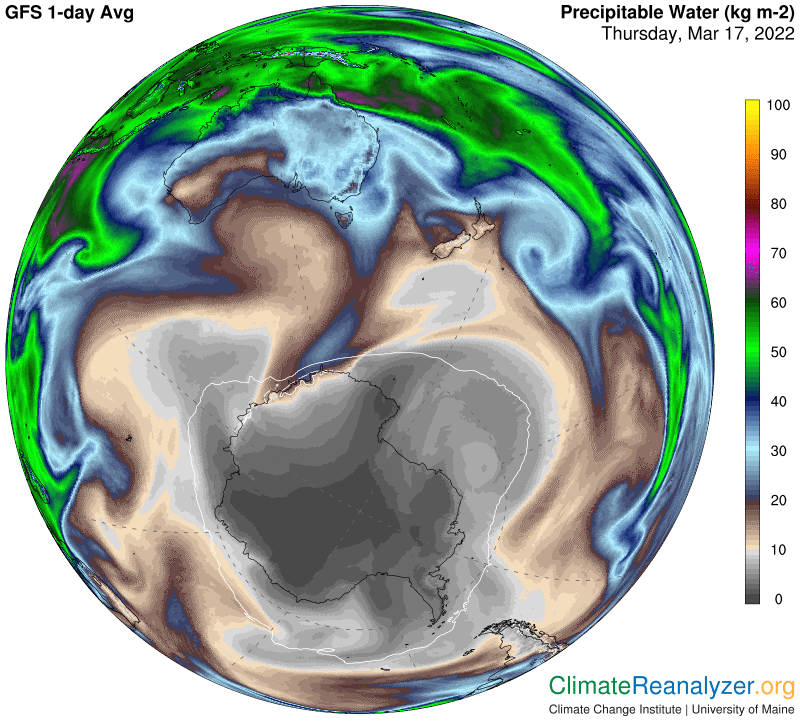
The PW map tells you with a quick glance why these two temperature sequences are divided as noted. The story is basically a sample of what happens everywhere else:
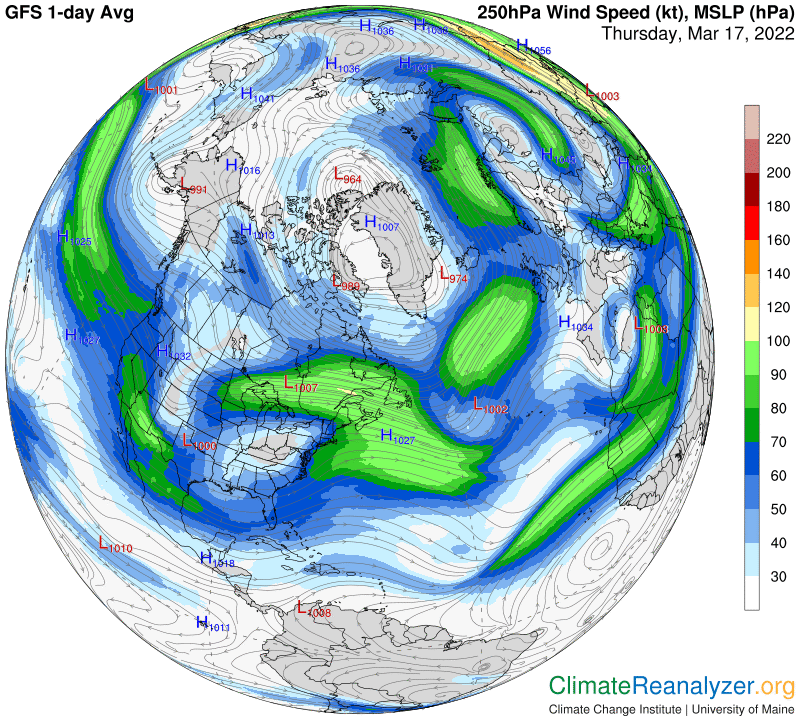
On the air pressure map observe the way the blue-zone border stays offshore with respect to western Siberia while overlapping over land in the east, extending over much of Alaska as well:
The jetstream winds that come and go on the long and winding pathway that tracks the border of the blue zone are positioned in ways that may be favorable to the movement of incoming ARs in some places, like on the Atlantic side, but have the ability to act only as buffers in other places, as we can see at this time on the Pacific side. Places where they die down the most is where incoming PW may have the best opportunity to find a way into the interior of the blue zone.
Now we want to see what’s going in in Antarctica, starting with its anomaly map. It’s clear that one large section is singularly responsible for the big number. There is actually one very small spot—that must be magnified to see, which has an anomaly in the very top bracket of the scale, meaning a bit greater than +32C. I have never seen that happen before. It is still very cold in that part of the continent—most likely around -45C for normal, and currently -15:
By my way of reckoning, an event like this could not happen without an extraordinary influx of PW, just as we see on the next map. The main area of warmest air (+30 anomaly) has a reading of around 4kg on the scale. Normally, any PW value associated with -45C can be estimated at no more than 400-500 grams—which means one is 8 times greater than the other. As understood in my theory, three doubles of PW weight will ordinarily make a difference of 30 degrees. Note the unusually heavy PW content of the AR as it approaches and successfully penetrates the continental interior:
That kind of penetration by an AR can only succeed with the help of a strong jet stream that has an unusual ability of its own to deeply penetrate the skies over the continent:
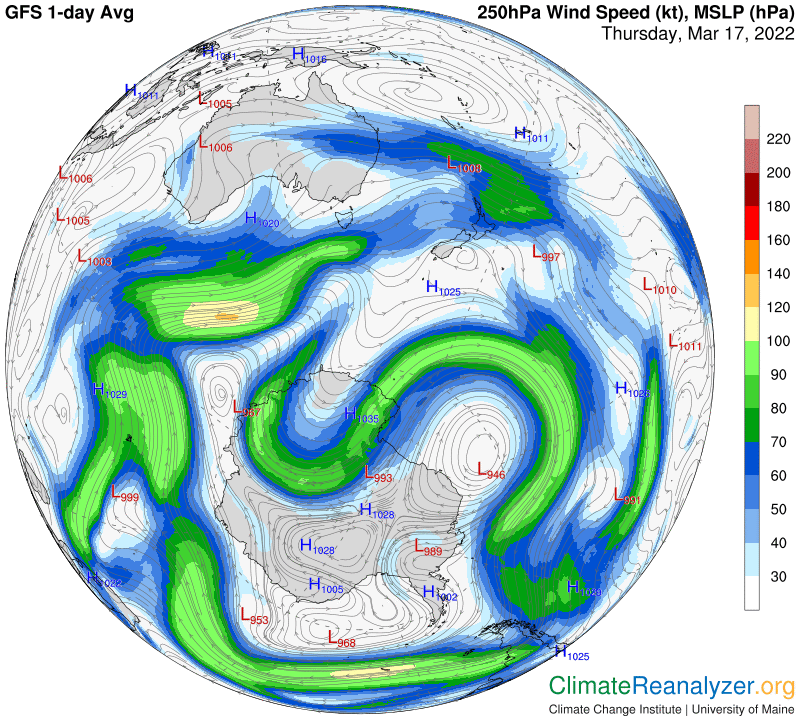
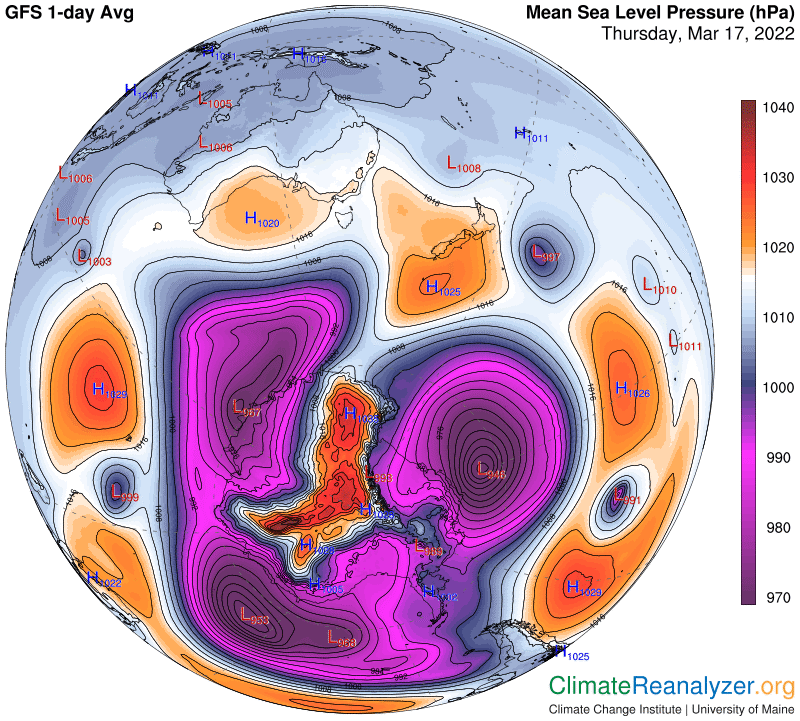
The next image accounts for the unusual shape of the pathway the jet stream is following. The border of the air pressure blue zone in the Antarctic region is normally quite regular. You seldom see a deep cavity like this one:
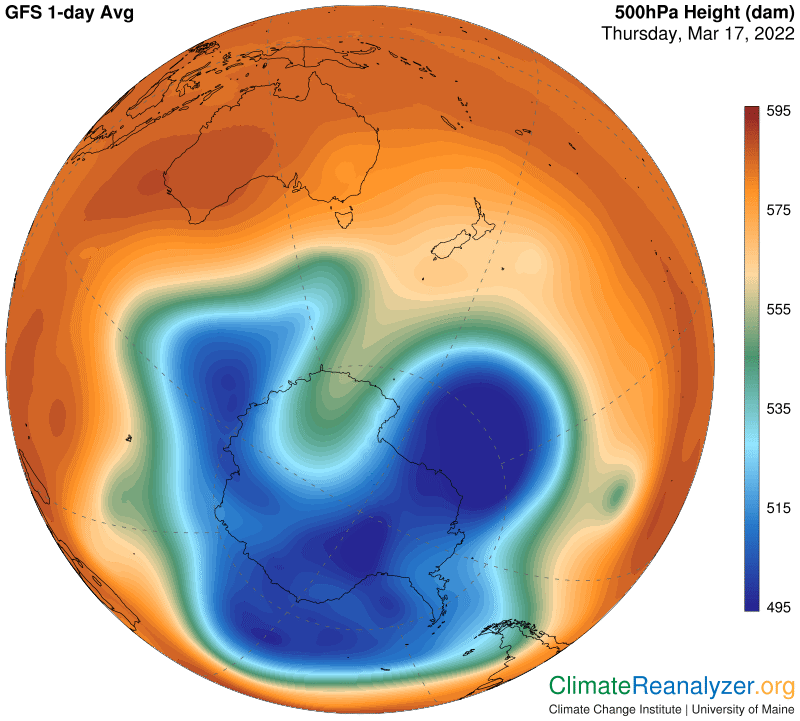
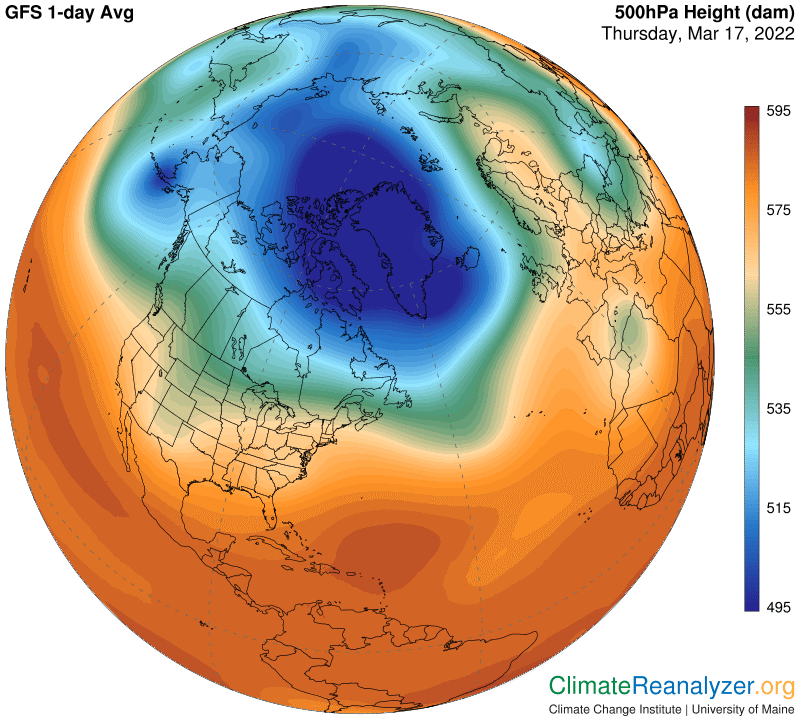
I must show one more map, where we see a zone of high sea-level pressure in exactly the right spot for enabling a strong influence on the high-altitude configuration of air pressure gradients. In effect, it “raises the canopy” of 500hPa readings at that location, putting this reading beyond the zone that normally maintains blue shading:
Carl