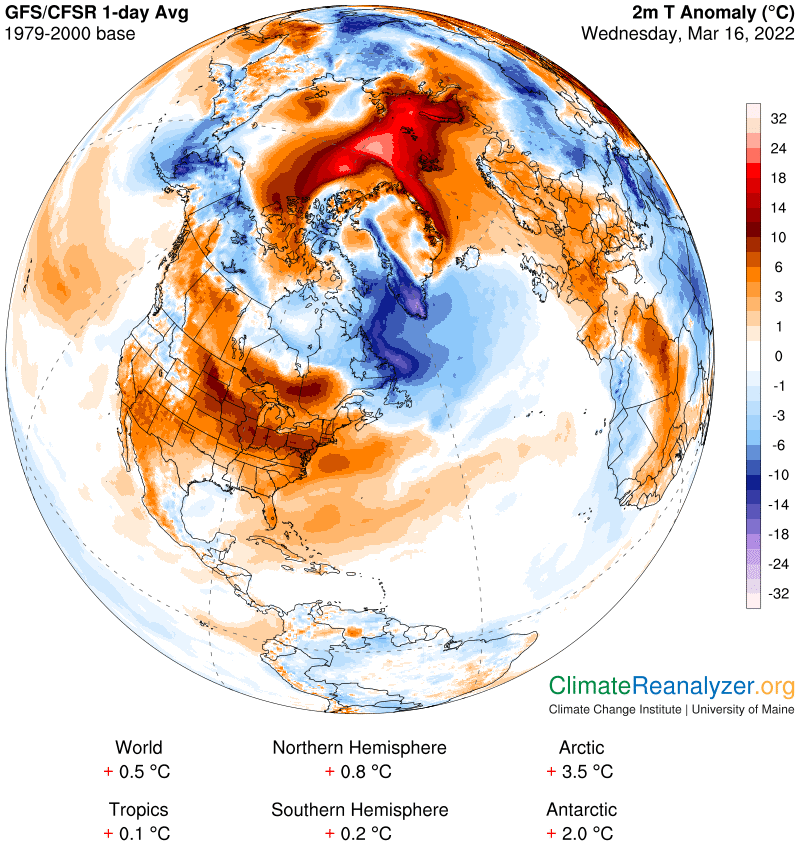
Another big day for Arctic warming—up 3.5C in just over three decades—and more than six times the global trendline increase for the same period (0.55C). The map shows us one spot quite close to the North Pole that has an anomaly in the +24-28 bracket when you apply full magnification. That is a huge number, equal to around +45F:
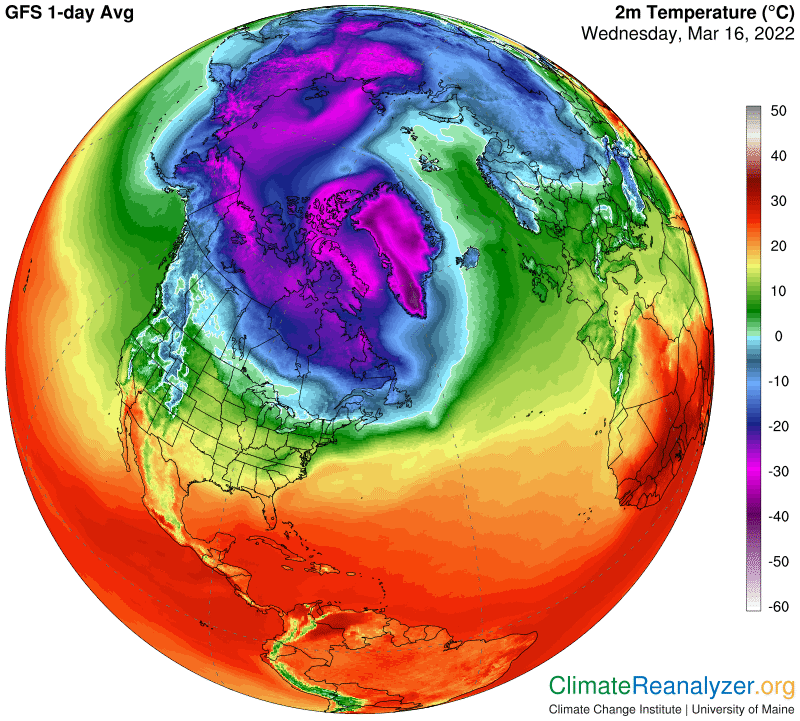
Here is how the situation looks from a temperature standpoint. There is obviously something unusual going on in the far north of the Atlantic that makes a considerable contribution to the warmth:
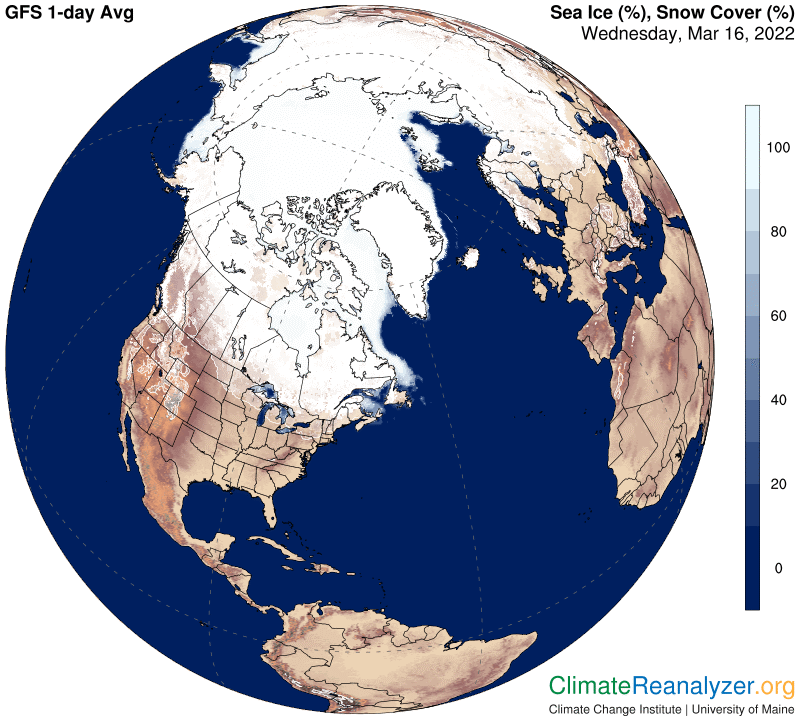
One likely contributor is easily spotted on the sea ice map. I can’t offer immediate evidence, but I’m quite sure the area of open water has expanded over the three decades, adding several degrees of local warmth for that reason alone. Open water would also add some extra moisture to the air via evaporation, creating a potential for more far-reaching greenhouse energy effects:
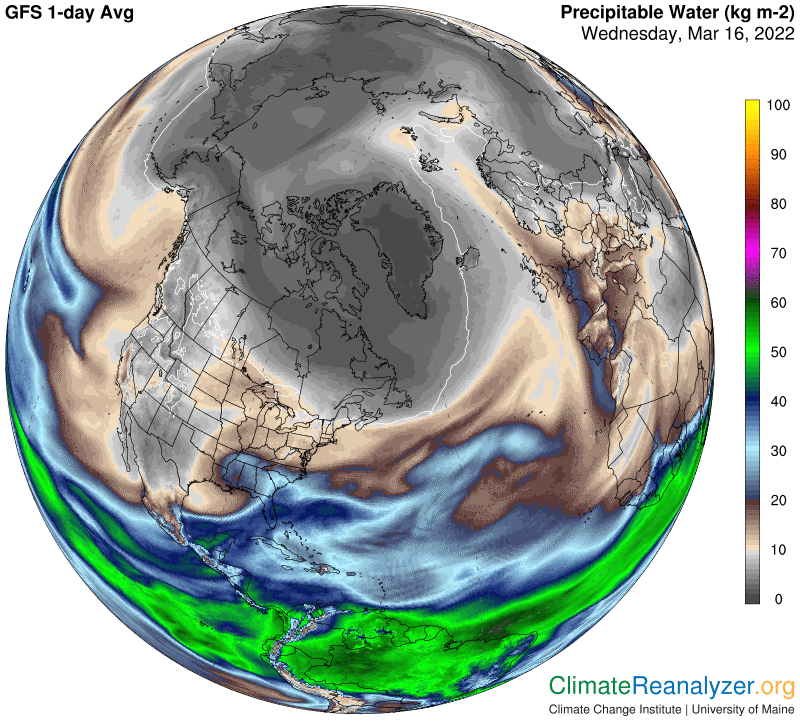
The precipitable water (PW) map is very much in step with this last thought, when you see how values have picked up over two areas of open water. Oncoming atmospheric rivers have thereby been fortified while continuing their journey deeper into the polar zone. Considerable spreading of PW content is pictured, heading out in two directions, especially so on the North American side of the zone. You will find plenty of local warming effects from these inputs on both the anomaly chart and the temperature chart.
Today I want to pay more attention to another kind of coincidence, this time on a broader scale, that involves a number of other weather maps. Go back to the temperature map and observe the compact, well-rounded shape of the cold air mass that lies within the dark blue area that extends toward the southeast for several thousand miles from the global top. On the above sea ice map you can also see how snow cover corresponds quite well with that same shape, which is not surprising. There are still more things that have corresponding imagery, starting with the configuration of high-altitude air pressure gradients. The blue zone on this map features a large, compact bulb-like shape that closely overlaps with the ones already pictured. We normally look for an association like this between the blue zone and sub-freezing surface temperatures, so once again there is no surprise:
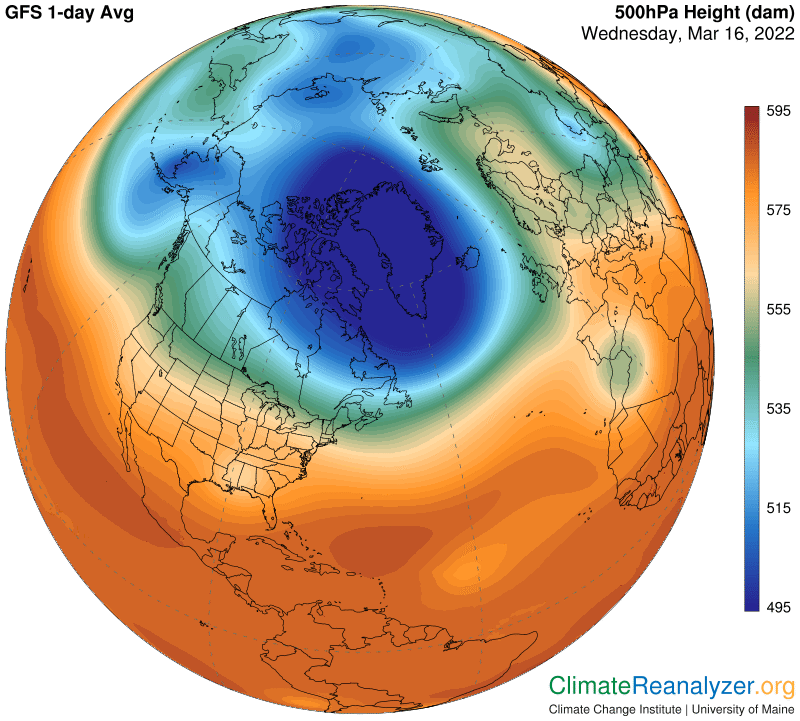
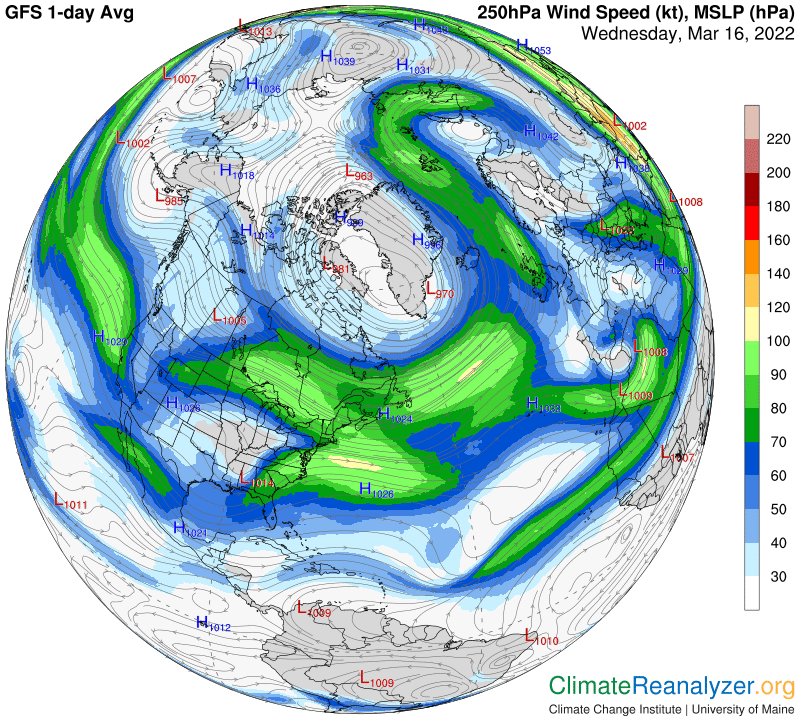
The border of the blue zone, in combination with the outer border of the green zone, regularly have full control over the positioning of two major jetstream pathways. We can see how true this is again today. The streams that appear on these two pathways typically have a significant influence on the prospects for atmospheric rivers to keep advancing on their courses of migration toward the poles:
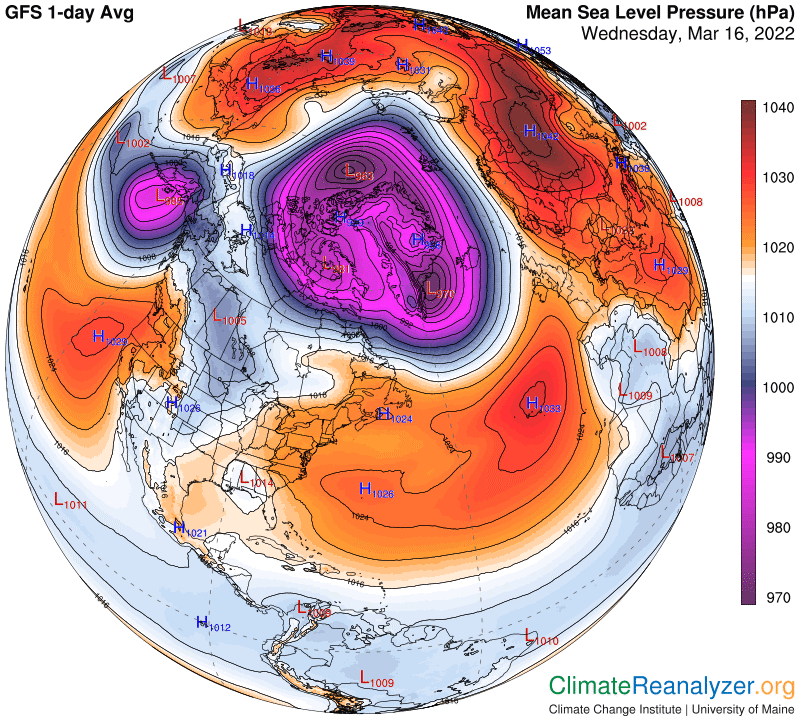
I’m not yet done showing maps that have this same, large coincidental image shape. The nest one shows the configuration of air pressure gradients as established at sea level. The large zone of low pressure that you see, plus the smaller zone of low pressure that branches off to the left, both have close correspondence today with the blue zone on the high-altitude air pressure map. Things are not always lined up this way, but when they do get lined up the low-level pressure, as I have noted before in several letters, seems to have an effect on the structure of the blue-zone pressure higher up. It does so in a way that appears supplementary to the contraction effect of cold air on the surface. The reasons are elusive, but should be worth investigating.
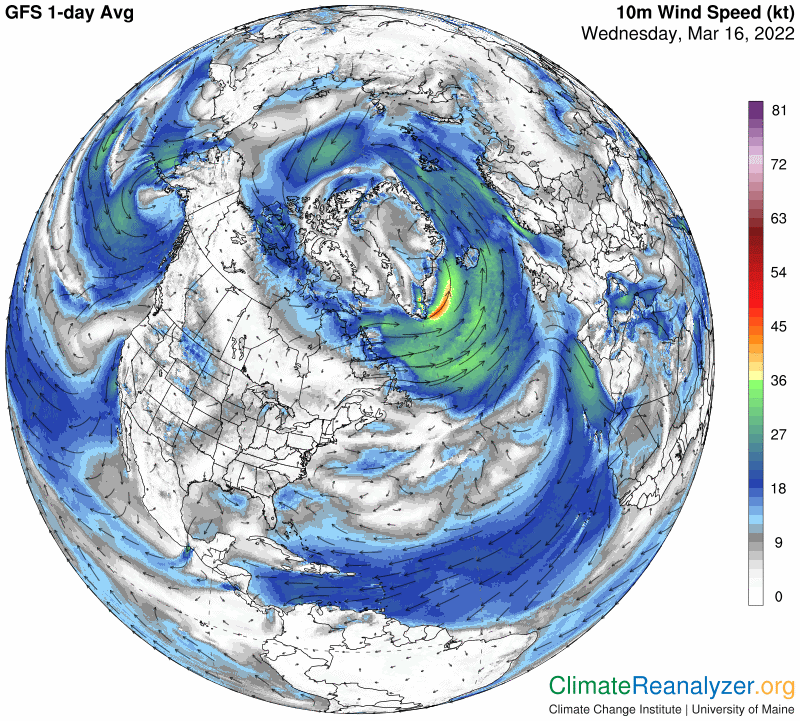
And finally, there is one more map to throw in because of the common fact that ground level wind pathways are typically controlled by the configuration of sea level air pressure gradients—which automatically makes them part of today’s mix. We also know these winds have the power to deliver PW over considerable distances as contents of a separate, low-level array of atmospheric rivers. Are Arctic temperatures being affected today by this sort of activity? Perhaps. On the other hand, a ring of strong winds appears to be imparting a cooling effect on Greenland today, as compared with the warmth that was there yesterday.
Carl