A new way of measuring the thickness of Arctic sea ice enhances predictions of further rapid decline. This was the conclusion reported in a study released on March 10 and reviewed by Phys.org:: https://phys.org/news/2022-03-icesat-remarkable-arctic-sea-ice.html. The thickest ice, which is the most difficult to clear away by melting, was reduced in volume by 16.3% in just the last three years. “Current models predict that by the mid-century we can expect ice-free summers in the Arctic, when the older ice, thick enough to survive the melt season is gone,” says the lead author. By implication, that timetable may need to be shortened by at least a decade. At the newly discovered rate of melting the thick, multi-year ice would most likely all be gone at the end of summer in another 15 years or so. The full study outlines the advanced method of measurement used for the research. Open access is found at https://agupubs.onlinelibrary.wiley.com/doi/10.1029/2021GL097448.
Any absence of sea ice on a given day produces warmer air air above the surface, a transition from solar energy reflection to absorption of energy in the waters below, and a new source of evaporation. All of these consequences have been happening for the last several decades and will remain in effect, especially during the late summer season. At this time of year none of them are operative, and the ice itself is quite well insulated by the snow that covers it. The amplified warming that we see almost every day must therefore have one or more other sources. These sources, moreover, are known to come and go with a great deal of irregularity from one day to the next. I have begun showing the same set of maps every day in order to build my case that the greenhouse energy effect of precipitable water (PW) introduced each day at high altitude by inflows from atmospheric rivers (ARs) is capable of performing as the agency. Here is today’s anomaly map, revealing a gain of 2.4C in the Arctic, an increase unmatched anywhere else by a wide margin:
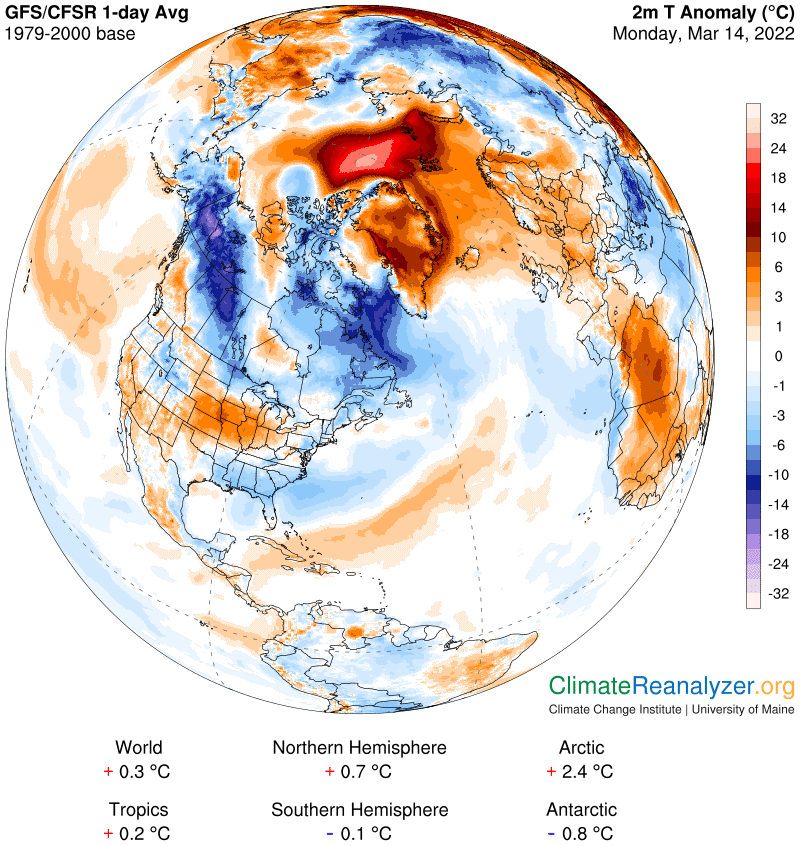
The most interesting feature is the exceptionally warm zone of anomaly at the very edge of the North Pole, which has a reading of around +22C—or 40F. Yesterday we saw a similar anomaly, moving northward around Greenland at the tail end of a long AR. The river is still there, somewhat stretched out, while continuing to make forward progress:
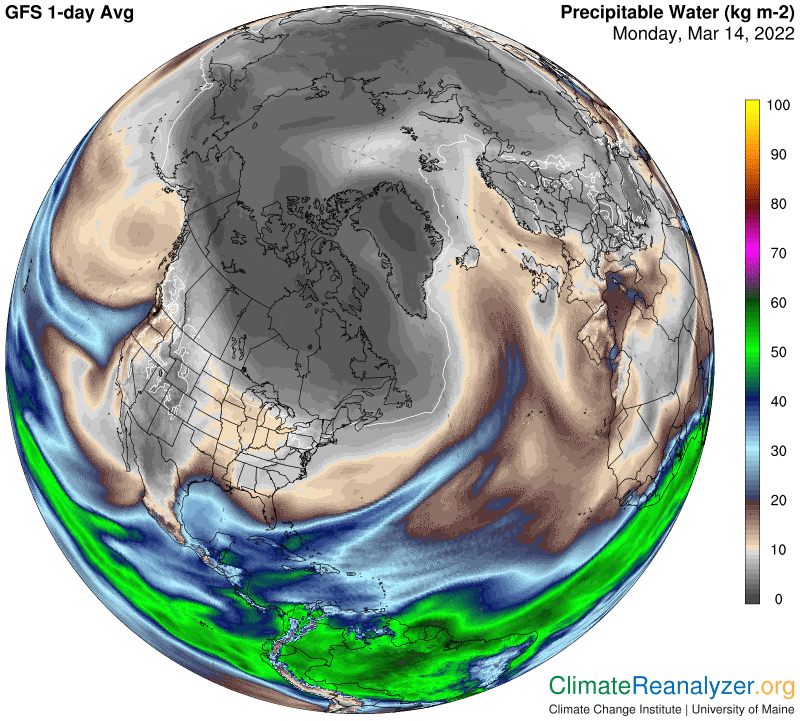
Overall, when you look at all the anomaly zones in the Arctic region, you can see a wide range of warm ones that measure +10C and up. The cold zones are smaller in size and lower in amplitude, which accounts for the final balance being above 2C. Our ability to make connections between PW inputs and all the different anomalies is limited by the fact that practically all of the PW values, apart from those coming directly off the one sizable AR, are sustained within a few brackets at the very bottom of the kg scale. Since every double in PW value, from any level, produces 10C of warming, we’d be much better off with readouts measured in tenths of kg at these low levels or even in grams. It does help to magnify the gray shadings to pick out their distinctive positions.
The high-altitude air pressure map again shows highly irregular boundaries around the blue zone, mainly because of the two dog ears at the top, as seen here:
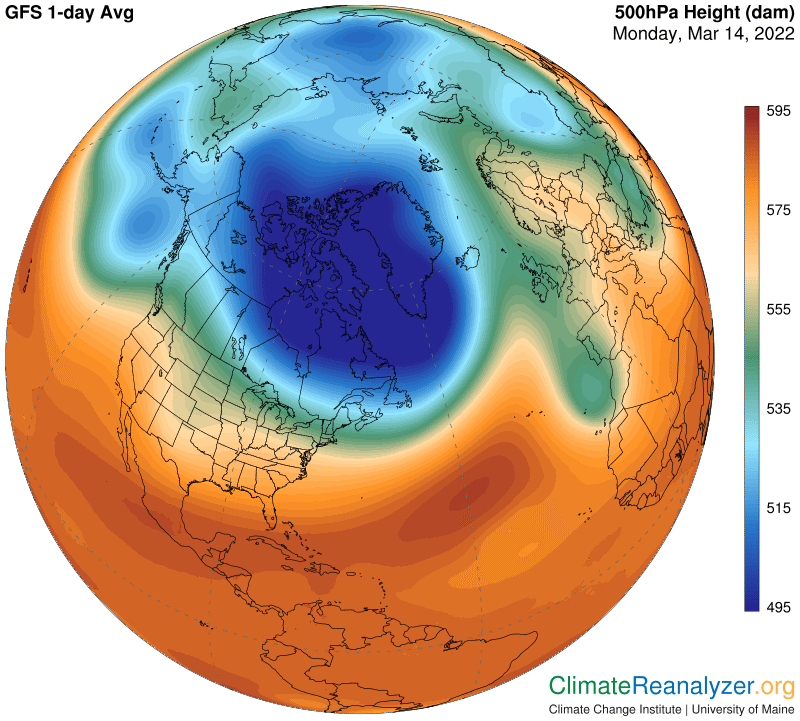
The ear to the right reflects the contracted density of a patch of extremely cold surface temperatures, which is perfectly normal:
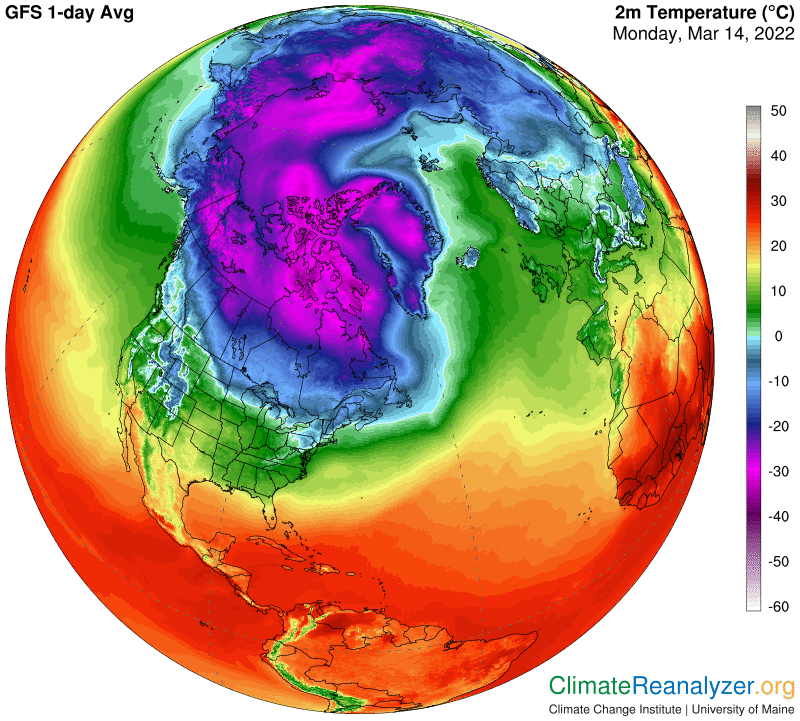
The one to the left is positioned over relatively warm surface temperatures, which requires an explanation. All I can come up with is illustrated by a very close spatial association on the sea level pressure map, a phenomenon that has also been noticed on previous occasion:
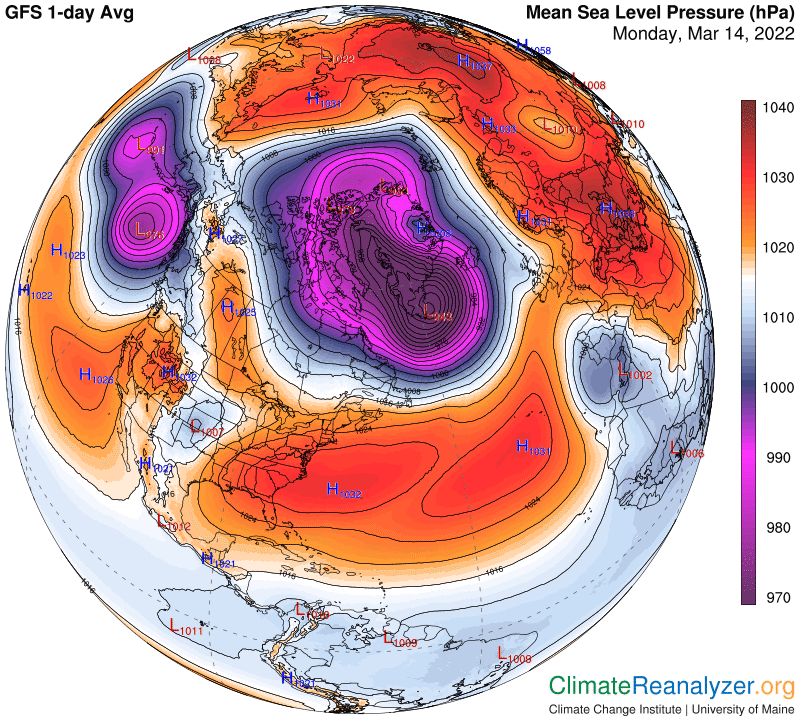
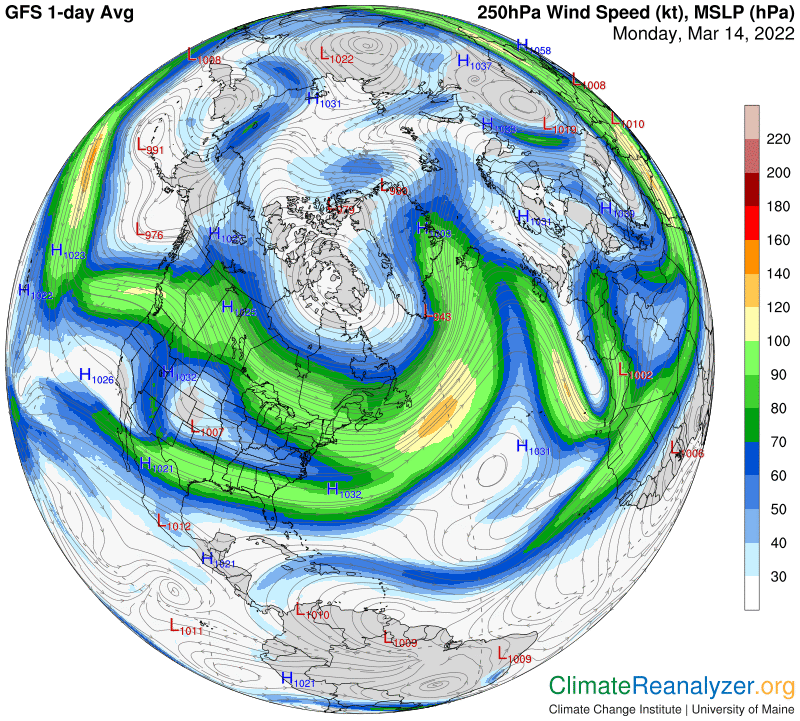
Both of these dog ear shapes have the same kind of effect on isobar placement, causing similar jetstream pathway formations that track the outer border of the blue zone. Every enactment of this kind affects the movement of PW concentrations that go on to have an effect on surface temperatures, and for that reason become worthy of study:
Carl