Weekend letters are being issued mainly for the purpose of daily archiving of images. Comments are added when something of keen interest appears—like we will be seeing today.
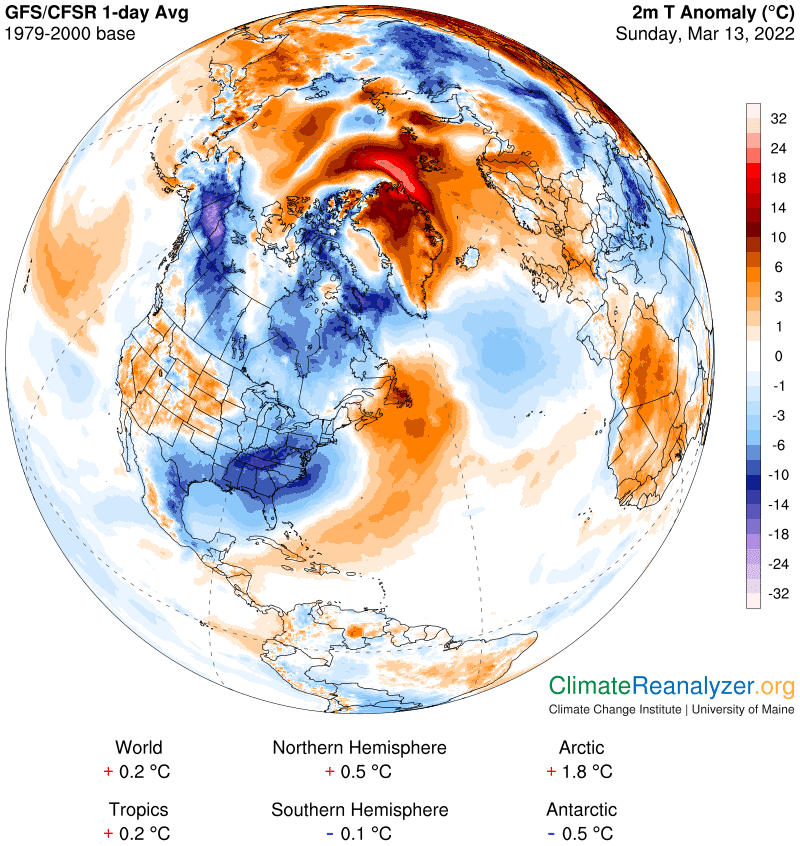
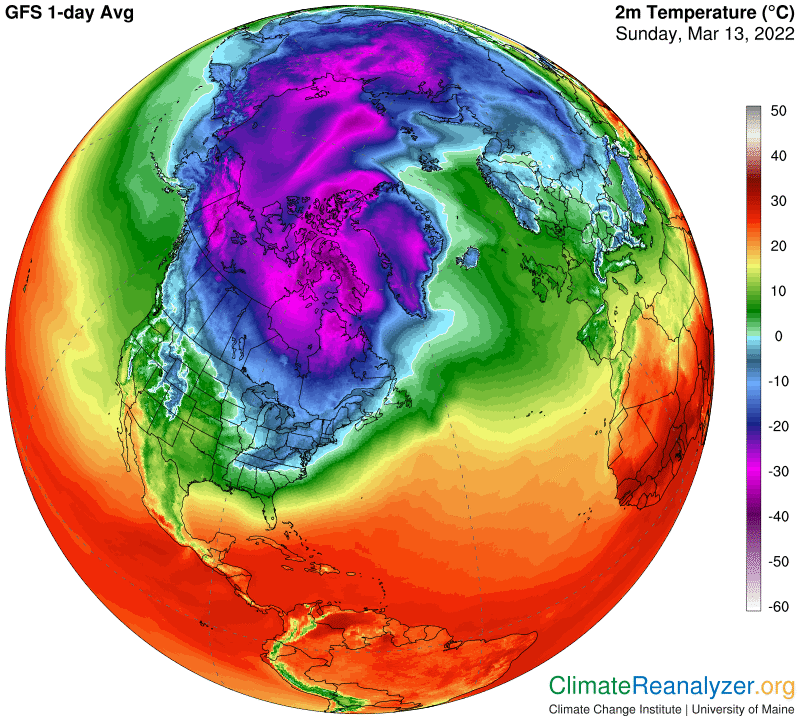
Look closely at the bright red area of anomaly extending from northeast Greenland toward the pole. The inner part of it has a section with a reading in the +21-24C bracket on the scale—around +40F. The actual average temperature in that spot has extraordinary readings as high as +1C, or 34F:
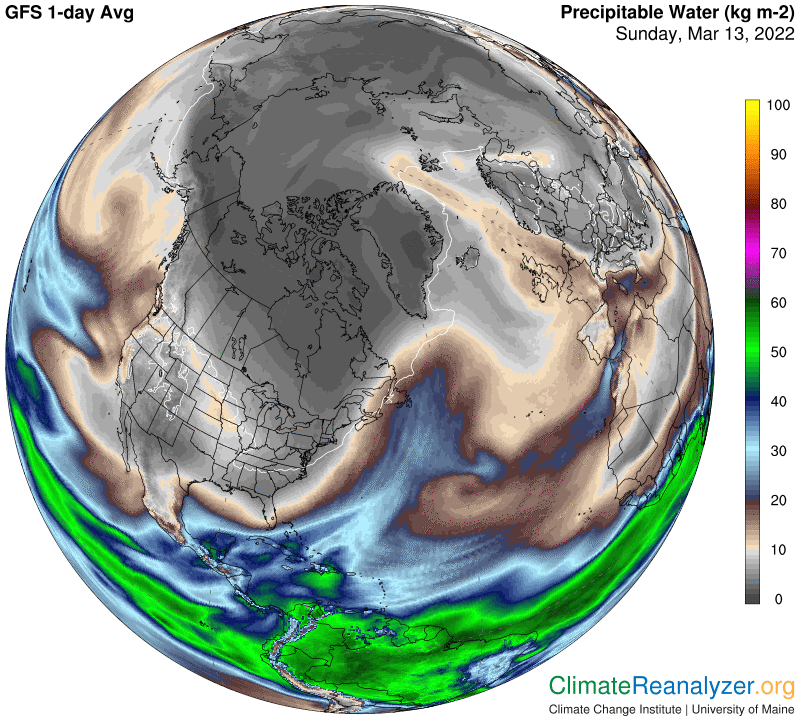
Nothing can explain such an extreme anomaly better than a strong influx of precipitable water (PW) at that location. This one has kg values in the 11-12 bracket on the scale. My estimate for the average kg value in that spot three decades ago is in the 2-3 bracket, let’s say 2.5. (It would be nice to have access to an exact number.) Today we are getting more than two doubles of that number, just as expected when searching for the most likely cause of an anomaly greater than 20C.
The jetstream map reveals the pattern of winds that trace out the same course as the complex of atmospheric rivers, as seen on the above map, that were responsible for transporting such a high concentration of PW to such a remote location. Some of the river vapor, under the influence of the way these jet streams are positioned, takes a detour all the way to the Strait of Gibraltar before heading north.
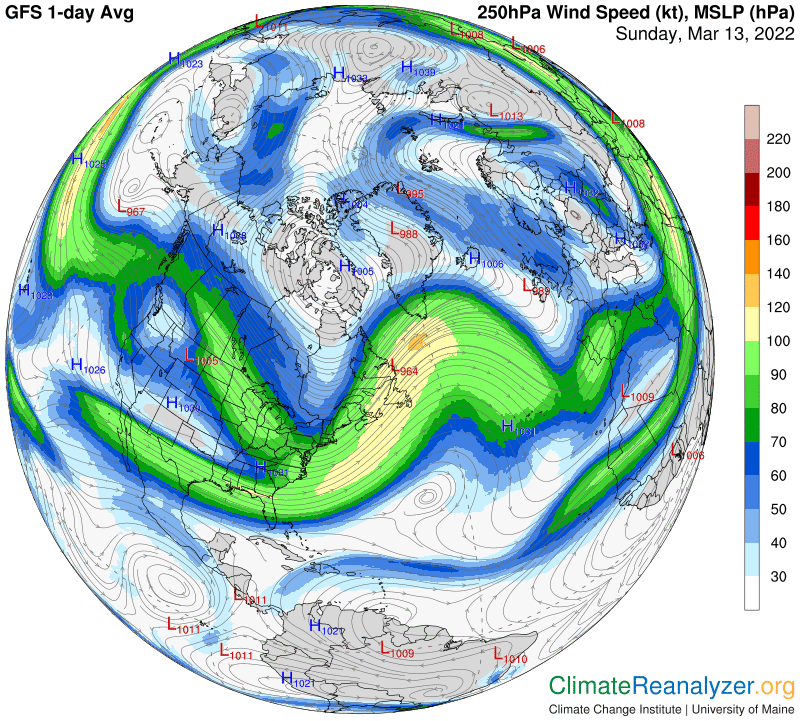
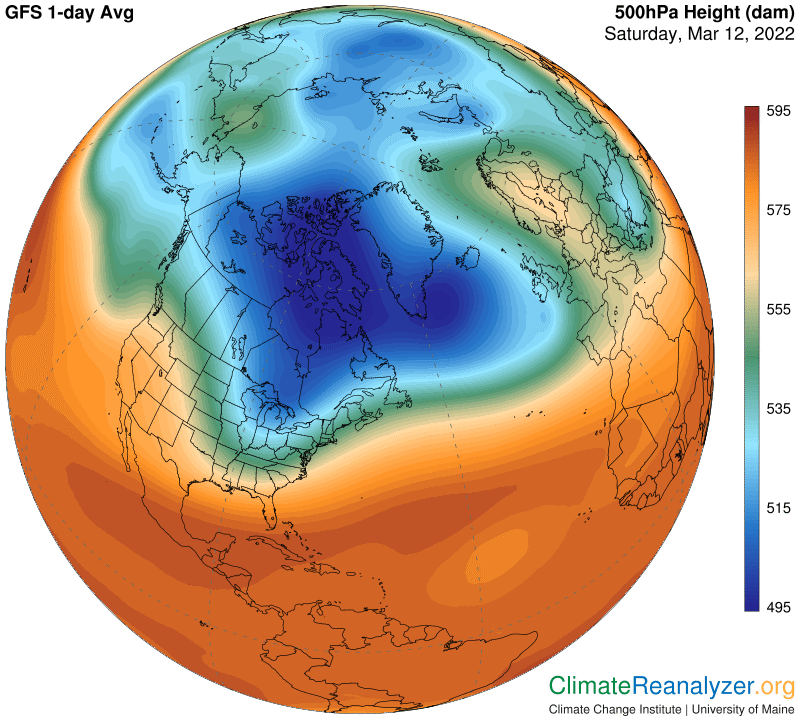
Jet stream positioning is always governed by the pattern of air pressure gradients that prevail at that altitude. This next map, despite its lack of isobars, accurately portrays the overall pattern. The jetstream map does a suitable job of revealing the isobars.
Carl