Today’s anomaly map. During the past week the world, tropics and NH have all experienced short-term cooling trends, the SH has been flat, and both polar regions have been warming. The Arctic today is very close to being on the long-term trendline as set up over the past three decades, which currently has a reading of +2.2C . The world’s trendline for the three decades is much lower, at just +0.55C. Each of the six designated regions on the map has its own peculiar set of factors that cause the region to be either above or below its long-term trendline on a given day. These factors can only be fully appreciated after doing an analysis of all the warm and cold anomalies over the entire region for the day, a daunting task. In the two polar regions this task is quite a bit easier than anywhere else, because these regions are relatively small compared to the others, their anomalies in most cases are relatively large in size, and the factors of causation for each anomaly are usually heavily weighted by how much precipitable water (PW) is in the atmosphere above each one of them on that day. These factors can be measured in a straightforward way and their effects can be calculated quite accurately.if one has the best available tools—estimates made with limited tools, like the ones I use, can still have value.
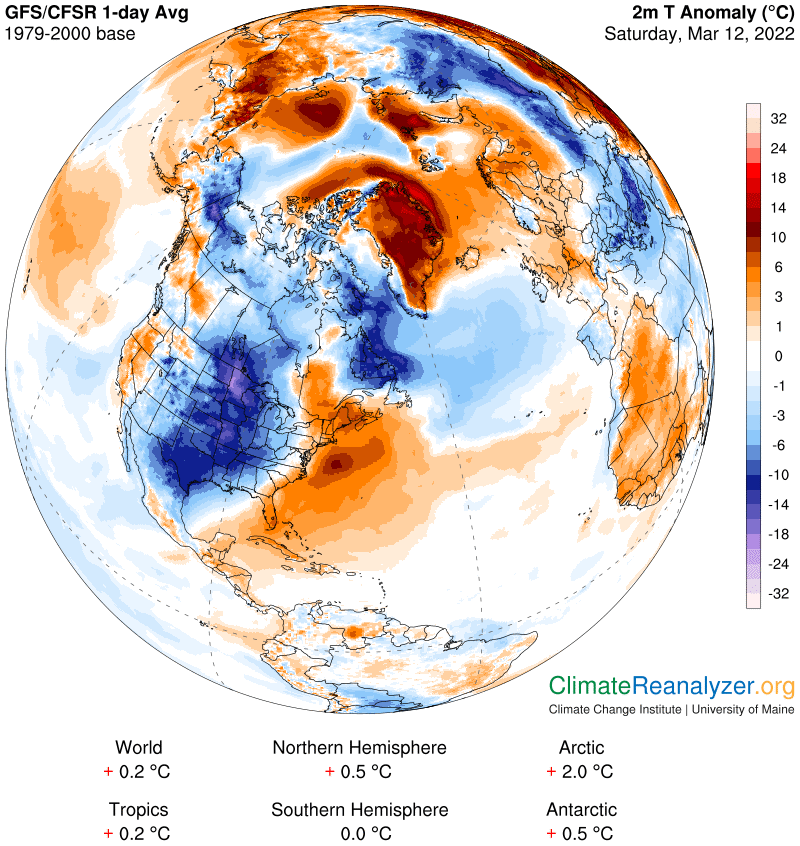
Now for today’s PW map. For a perfect example of how low-value PW, in terms of kg weight, causes cooling of surface temperatures, look for the slender T-bone shape in dark gray that crosses the center of the Arctic Ocean on this map, then match its shape with the position of the cool anomaly in the same area on the top map. The same principle applies to the interpretation of every anomaly:
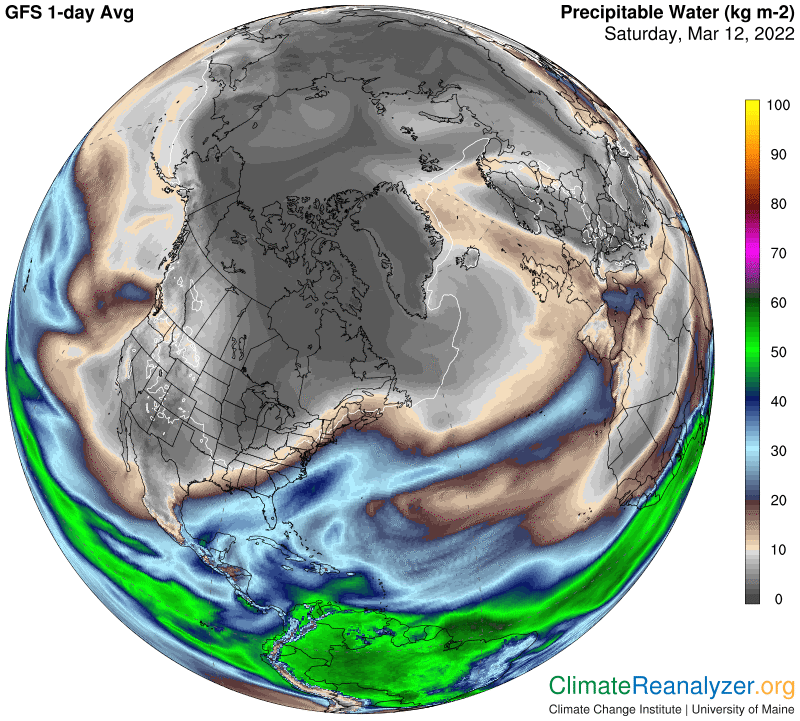
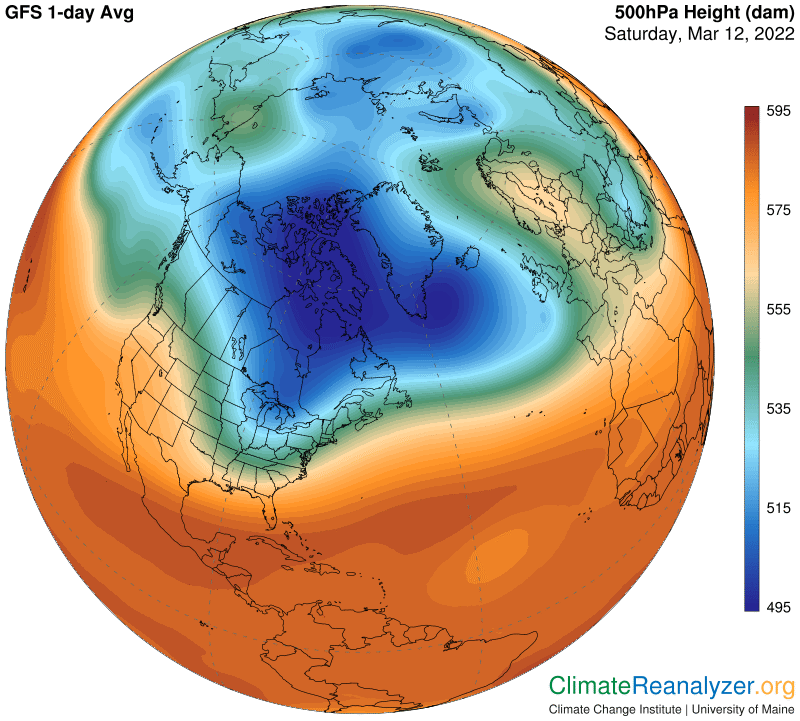
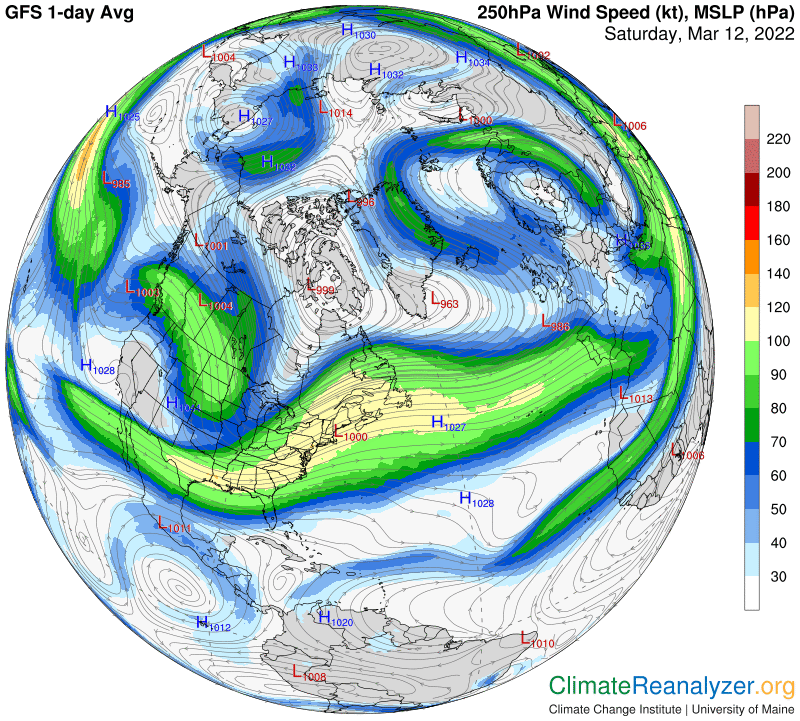
The next two maps are saved today as archives, without comment. They provide illustrations of processes that occur high in the atmosphere. These processes have a powerful influence over the final destiny of the PW content of the atmospheric rivers that are seen approaching the polar region in the above map, following journeys that originate in warm tropical waters.
Carl