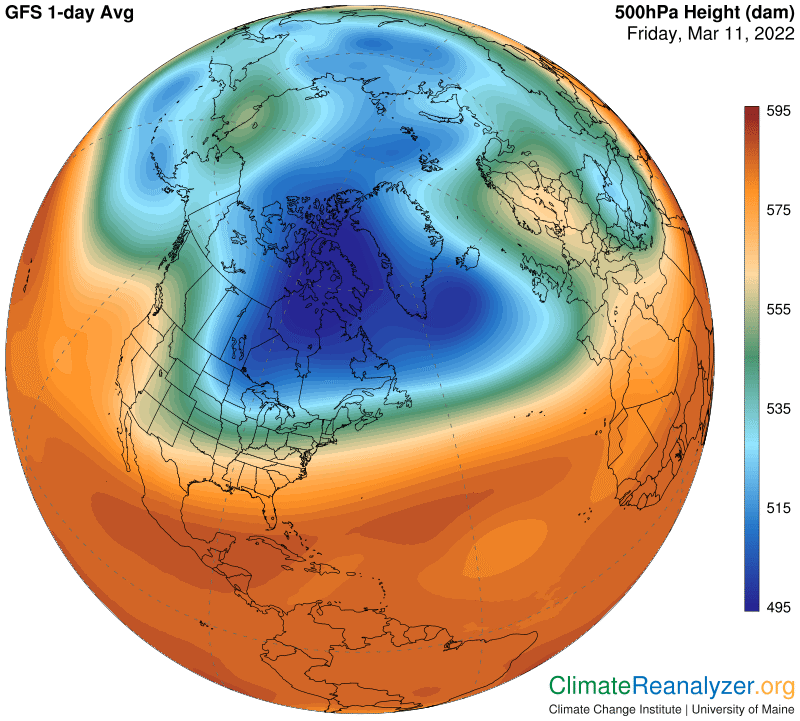
This is a followup on the ideas presented in yesterday’s letter. We are focused on why the “blue zone” on the high-altitude air pressure map is structured as we see it each day. This is interesting because of real-world implications—a major jetstream wind pathway always forms along a track marking the outer border of the blue zone. This track follows the thin line shaded in light blue. The wind streams on this pathway, coordinated with similar streams on another major pathway tracking near the outer border of the green zone, have a profound influence on the late-stage movement of incoming precipitable water (PW) concentrations in the nearby atmosphere.
The high-altitude configuration of air pressure gradients takes its shape at an altitude about three miles above the planetary surface, and holds that same basic shape all the way to the top of the troposphere. Below three miles, down to sea level, the air pressure gradients become configured in a different way. Each of these two configurations is home to its own peculiar wind system, with pathways that all tend to follow courses tied to unbroken lines of gradient differentials. The upper level is the home of a wind system featuring the presence of jet streams, following pathways on courses that generally circle the entire planet in each hemisphere within a limited range of latitudes. I have identified four of these major pathways. The two that are closest to the pole are of special interest with because of their influence on PW movement, a principal source of volatile polar temperature changes.
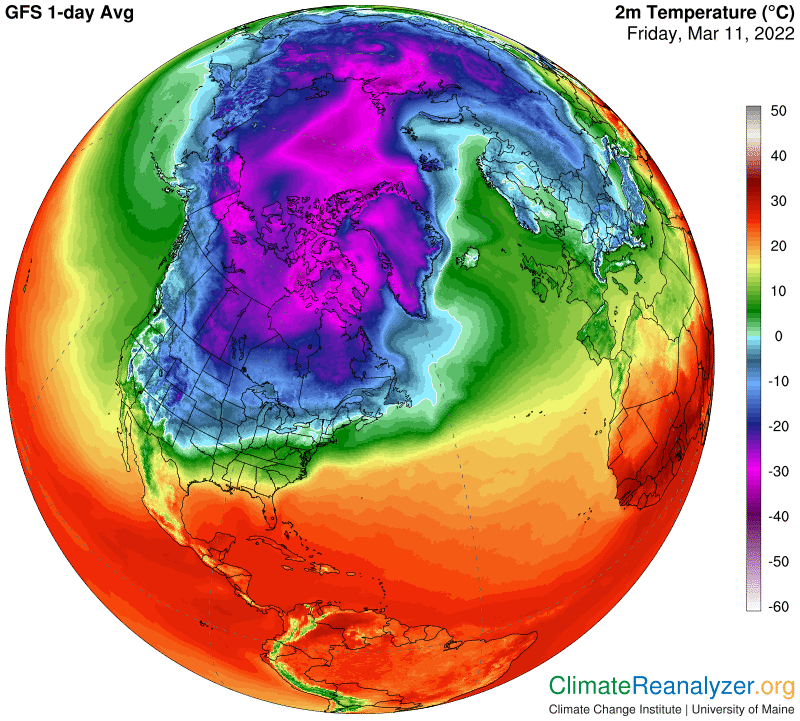
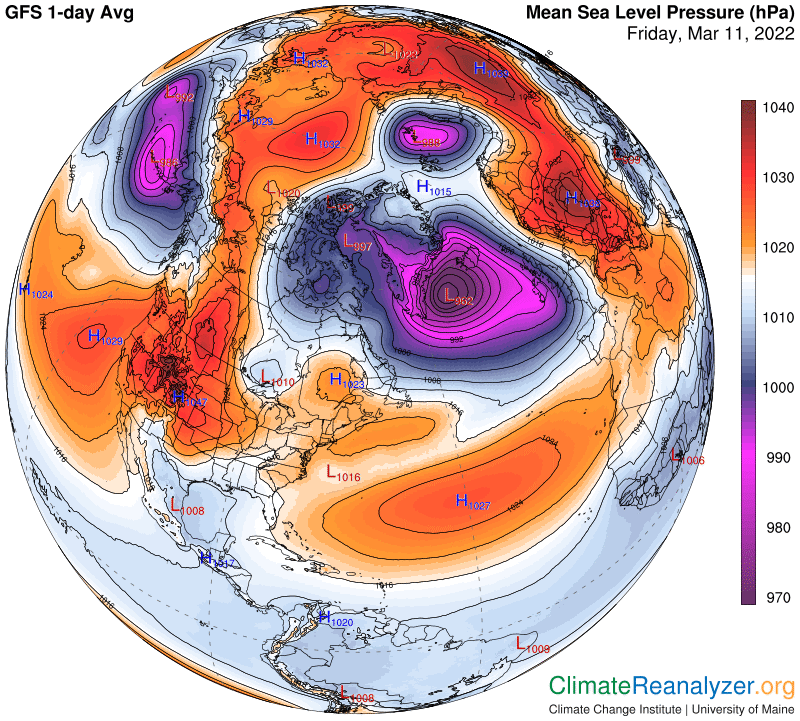
Yesterday I concluded that sea level air pressure appears to have a significant effect on the shaping of the blue zone, acting as a supplement to the primary effect, which is directly tied to surface air temperatures. Plausible reasons were advanced, with results illustrated by two examples in offshore locations having a combination of relatively warm surface air and low sea level air pressure. The area of combination provided a good match with the shape of an expanded blue zone, and we’ll see a repeat performance today. In these locations, low sea level pressure is having a pressure contraction effect that overcomes the expansion effect of air temperatures that are well above the freezing level. Here are the three most relevant maps, in the order of high-altitude air pressure configuration, average surface temperatures and sea level pressure:
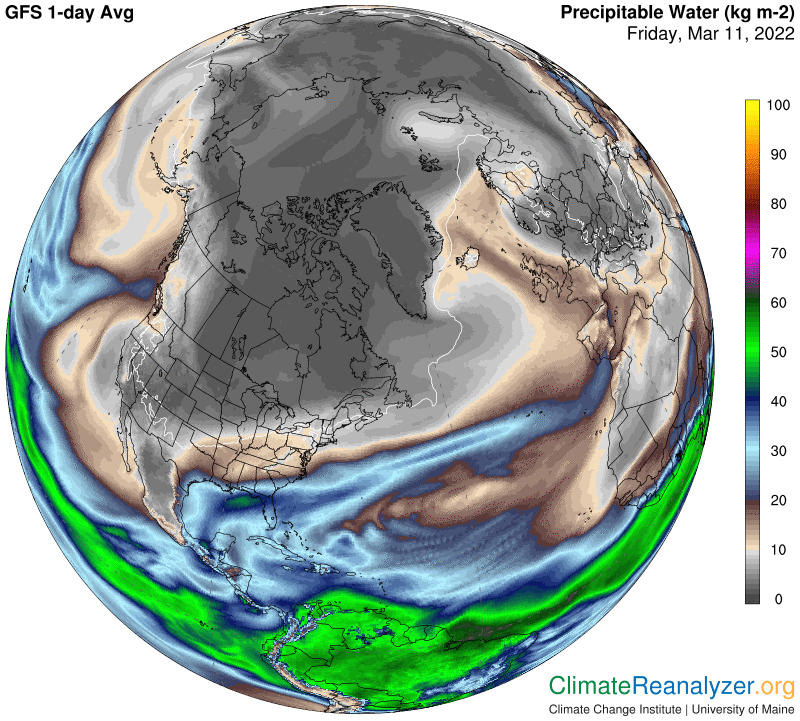
What I am looking for today is an association between relatively high sea level pressure and some kind of contraction of the blue zone as a possible corollary, using the same maps. The thick ring of SLP that surrounds much of the Arctic offers an opportunity. I can see several strong hints of a connection but nothing robust. What I do see that is interesting is drawn from imagery on the PW map. A zigzagging zone of PW can be seen coming off the Atlantic, crossing Scandinavia, turning and heading straight for the Arctic Ocean. At that point movement stops abruptly and an unusually high concentration of PW forms within a small, well-enclosed area:
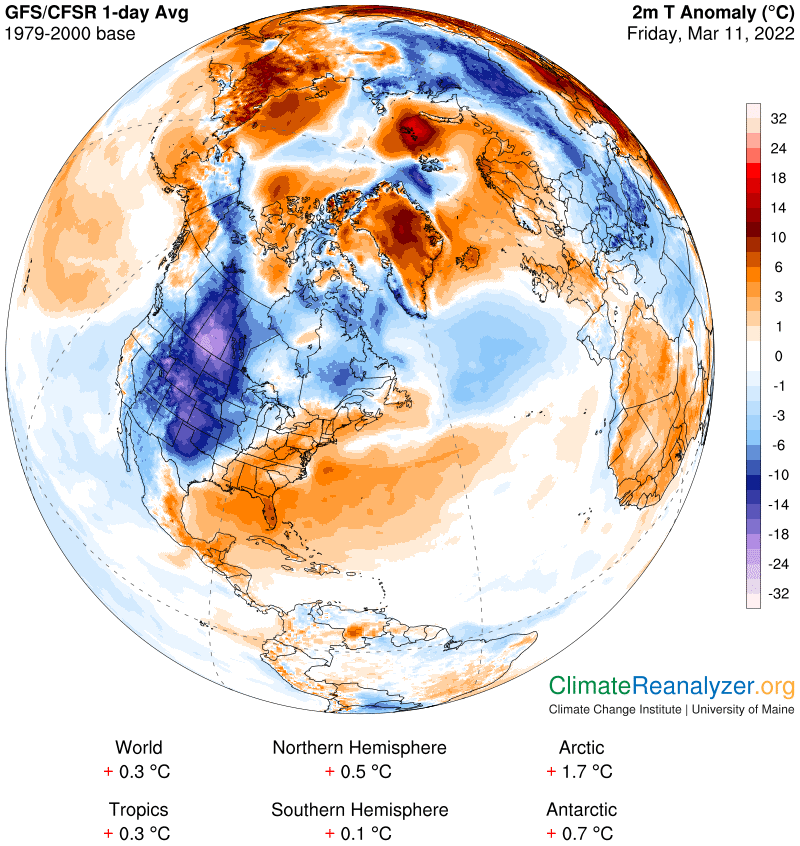
There is at the same time a very warm anomaly on the surface of that one little spot, measured in the +16-18C bracket, with no apparent outside source of heating:
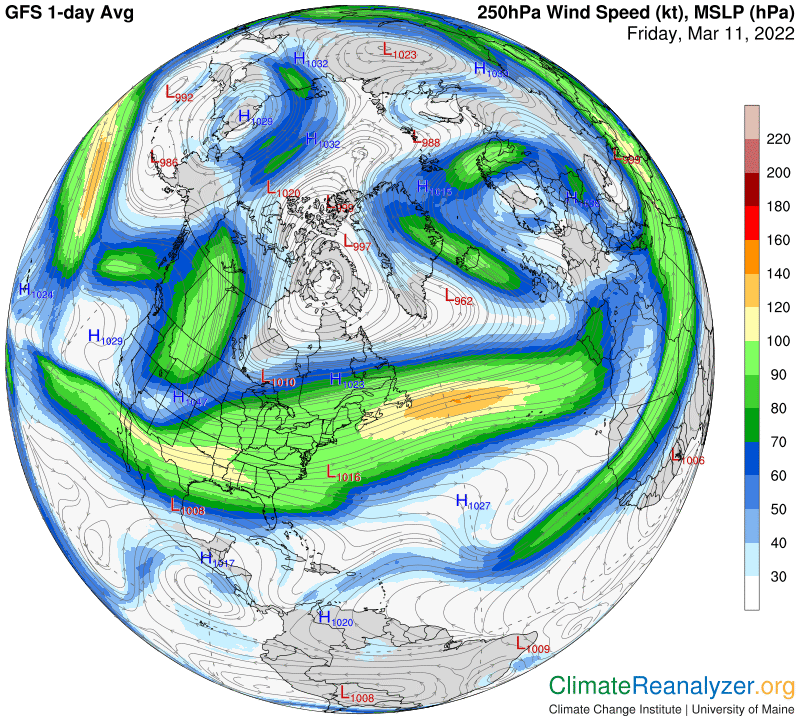
That exact same little spot can also be identified on the SLP map (third from the top), representing the center of a small zone of tightly-wound low pressure. This mysterious event prompts us to open the jetstream wind map:
A relatively small jet stream can be seen forming a tight semi-circle around that same spot, apparently compressing the PW trapped within this stream into a small area of exceptional concentration. Other compression zones of various shapes and sizes can be spotted elsewhere in this region on the map. The Arctic can be thought of as a natural place of atmospheric convergence, many of which may have unnaturally strong temperature effects.
Carl
