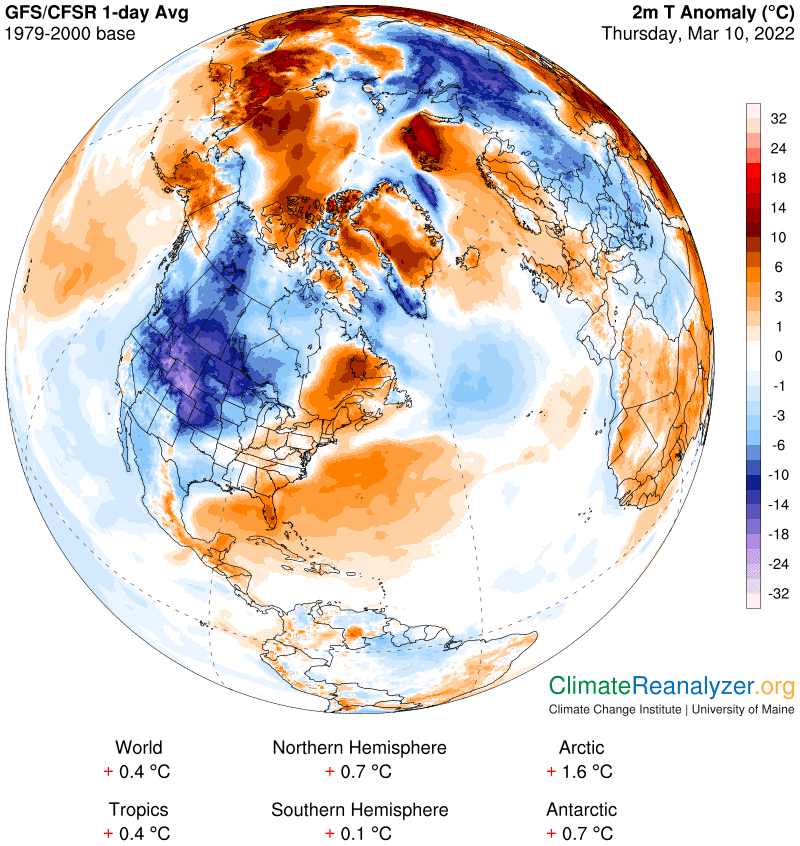
Yesterday’s letter described the processes behind the formation of hot and cold temperature anomalies on a daily basis. These anomalies have more volatility in the Arctic than anywhere else on the globe. They are created by the highly irregular distribution of precipitable water (PW) each day in the atmosphere above the Arctic, which can be considerably above or below average over all locations. The amount of PW in the Arctic atmosphere each day, and the way it is distributed, have a dominating influence on the formation of every anomaly. In turn, the irregularity of PW’s volume and distribution is greatly influenced by the nature of jetstream wind activity in the vicinity of the Arctic region. This activity is more or less irregular for its own set of reasons. The influence of jet streams on PW movement can be either effective or ineffective, depending on their structure and positioning. In turn, the structure and positioning of these winds is highly dependent on the configuration of high-altitude air pressure gradients. These gradients establish the pathways that winds are destined to follow, and they are subject to their own aspects of irregularity. The impact of all this activity has a great deal of interest and can be studied. We also want to know, if possible, what causes the high-altitude air pressure configuration to be what it is on any one day, and that will be the main subject of today’s letter. Let’s look at the configuration on this day. It is quite unusual, with some signs of strength and stability and some signs of weakness and distortion:
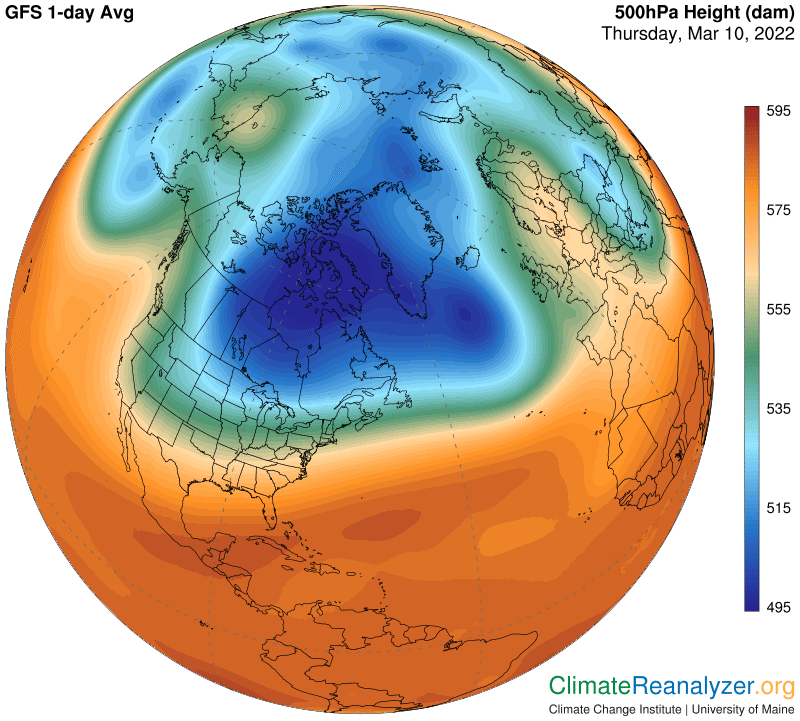
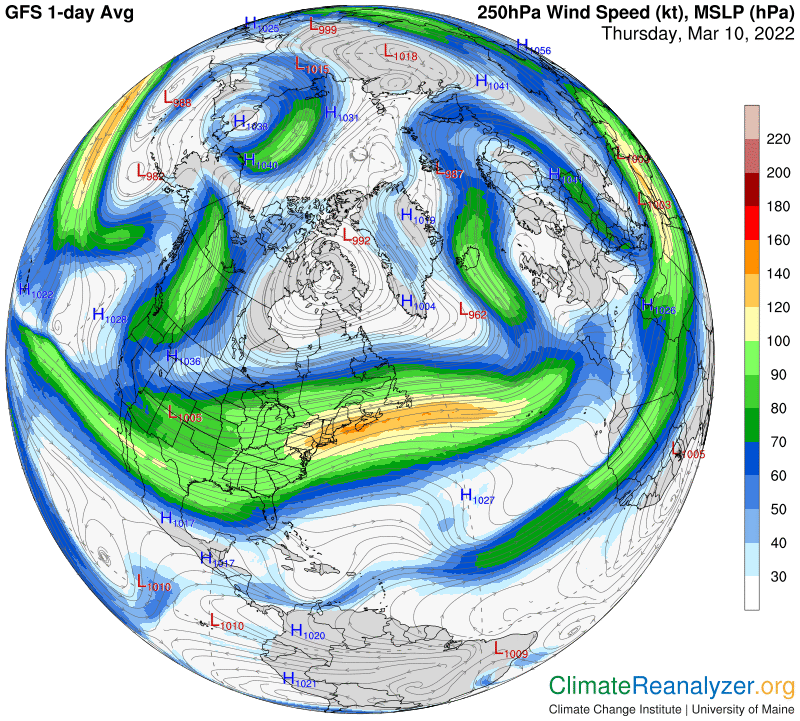
The color shadings mark out the courses that determine four major jetstream pathways. Today we are most interested in two of these pathways, the ones closest to the Arctic zone. One of them tracks the light blue line that borders the blue zone, the other the dark green fringe around the border of the green zone. Both pathways are manifest on the following map, exhibiting extreme contortions around the two long wings plus many variations in wind speed, which always tends to accelerate when any two pathways have come close together and weaken at any points of sharp bending of a pathway.
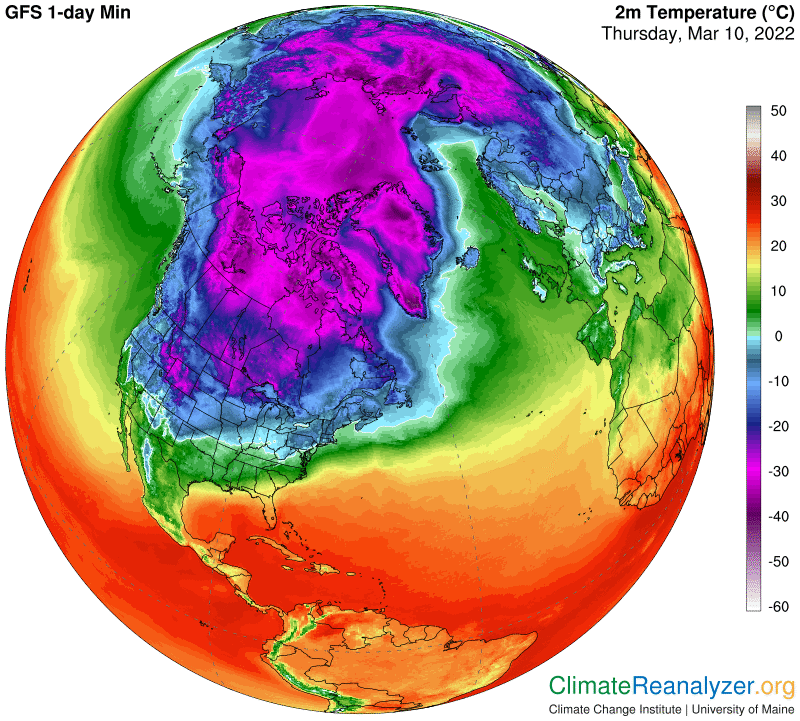
Now back to the configuration map. What causes the color-shaded zones to be where they are? Basically, all of the shades reveal differences in altitude at every location. The differences, as indicated on the scale at the side, are representative of 50% of a column of air’s total molecular weight at each location. The 50% factor is always lowest in the blue zone. Why? There are two reasons. One, because of the common presence of cold surface air temperatures, in most cases below freezing. Cold air always contracts, thereby bringing all of the lower level air molecules closer to the surface than they would be over a warm surface. The second reason is dependent on what we know about total air pressure at sea level for any location. The higher it is, for any reason, the more molecules there are in the total column of air from top to bottom at that location. When the total is relatively high the 50% factor at that location will also be relatively high for that very one reason. All else being equal, if the total number were any lower so would its 50% factor be lower. A lower total will thus tend to favor an extension of the blue zone when it exists beyond the areas of coldest surface air. Any such extension will thereby affect the positioning of the jetstream wind pathway that borders the blue zone. We need to open two more maps to demonstrate the effect, starting with regional temperatures, where the broad expanse of bitter cold is an outstanding feature today:
Next, here is how sea level air pressure sets up today. The large bulge of low pressure extending into the Atlantic is prominent, and so is the flatter bulge extending into the Pacific on the other side. Both of these bulges appear to be having an effect on the shape of the blue zone in the upper atmosphere (top map), and can also be seen covering areas that have relatively warm surface temperatures in the previous map.
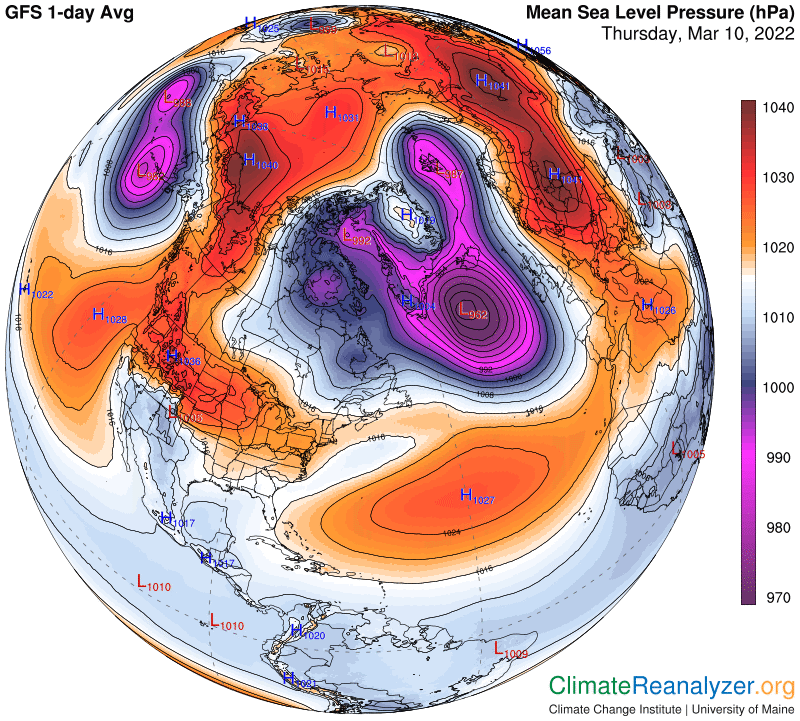
The expanded blue zone responds by creating a jetstream pathway in the customary manner, tracking the light blue line at the outer border of the zone. The jet streams that occupy these oddly shaped pathways perform in the customary manner, which means they have a customary effect on the movement of PW in those parts of the atmosphere. They do so because of bulge shapes of their own, with enough strength to alter the movement of incoming PW as a result:
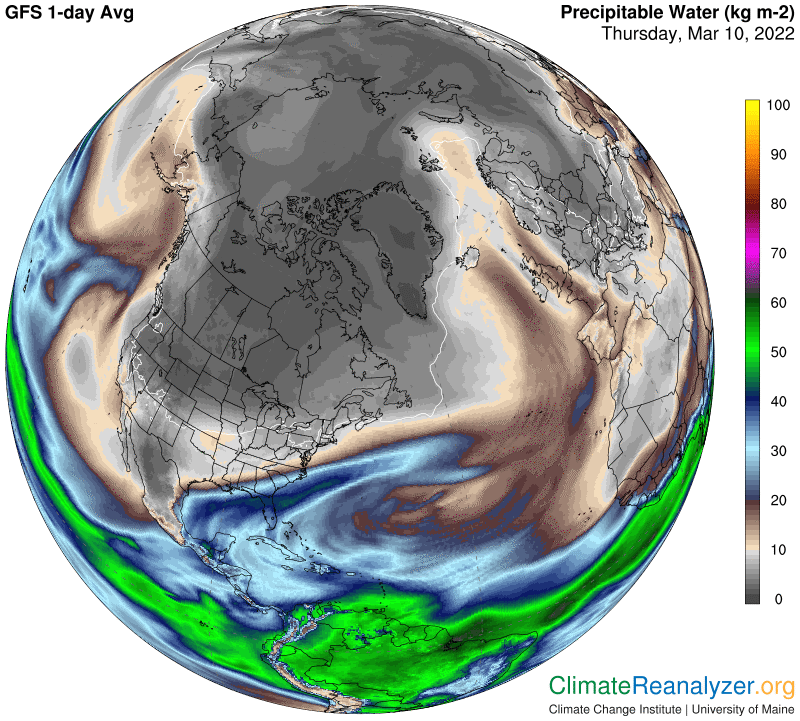
Reduced levels of PW typically go on to have a cooling effect on temperature anomalies at the surface. Today the effect is most visibly illustrated in the location of the Atlantic bulge:
What we learn from all this is that sea level air pressure has feedback effects on surface temperatures that are specifically transmitted by processes that take place in high-altitude parts of the atmosphere. This is something worth studying, and worth knowing about, whether or not the phenomenon has a meaningful net effect on surface temperatures in the long run. It’s an open possibility.
Carl