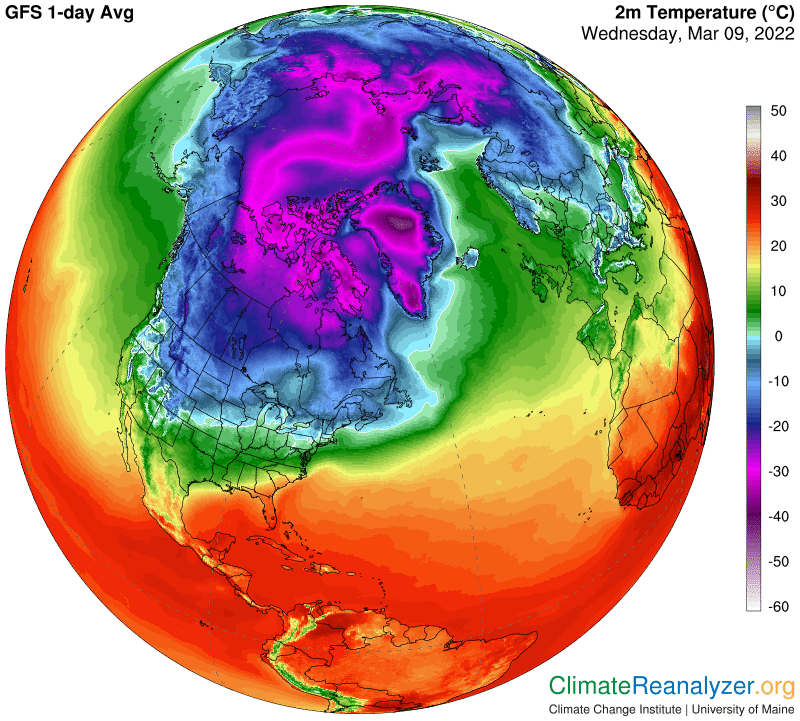
Every day we have been looking at peculiar mixtures of hot and cold temperature anomalies over North America. Every following day there is a whole new set of anomalies, many of them tied to new locations. The ratio of hot ones to cold ones, in both area and intensity, is always changing, sometimes rising and sometimes falling, often resulting in an advanced level of temperature volatility. Volatility tends to be greater in the two polar regions, especially in the Arctic, than anywhere else We want to know all we can about the direct causation of these happenings, with an expectation of many complications. Today I will conduct a quick tour of personal observations, as derived over time,from studies of Today’s Weather Maps, with illustrations and a few, mostly abbreviated explanations. We’ll start with a regular section of today’s anomaly maps. As usual, we see a wide assortment of hot and cold results:
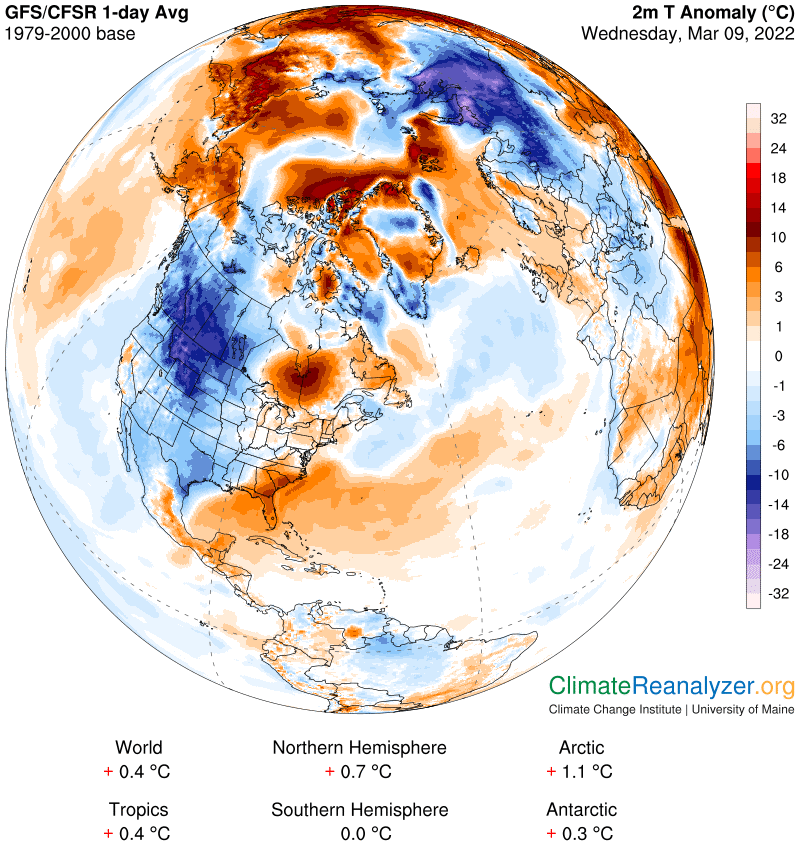
Every anomaly is associated with the relative amount of precipitable water (PW) in the atmosphere over the same location. The distribution of PW values covers a wide range of differences, everywhere. Relatively higher PW values cause warmer temperatures, lower ones, cooler. For one outstanding example of the effects of relatively high PW check out the area around the southern tip of Hudson Bay and refer it to the same area on the top map:
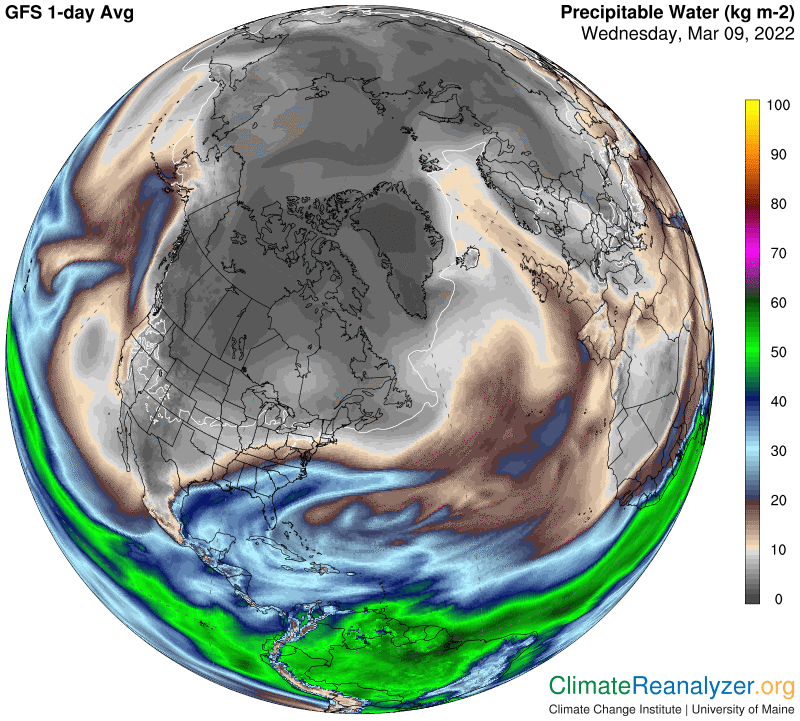
What is the reason for the erratic distribution of PW that we see all over the map? It starts with the way large concentrations of water vapor originate when atmospheric rivers (ARs) are formed from tropical waters and elevated to higher altitudes. Some rivers remain within the lower level wind system and others rise to where upper level winds prevail, dominated by jet streams of many different shapes and intensities:
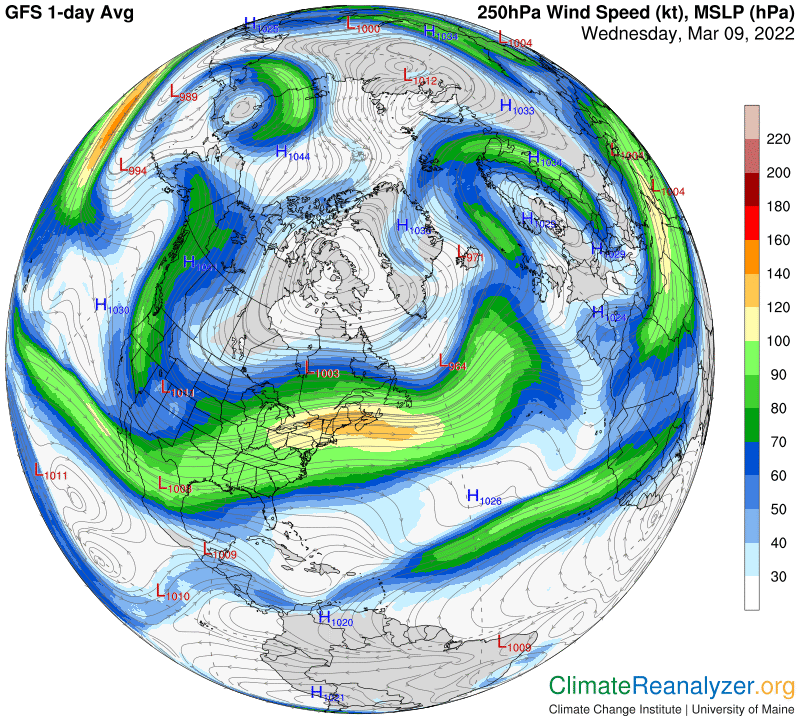
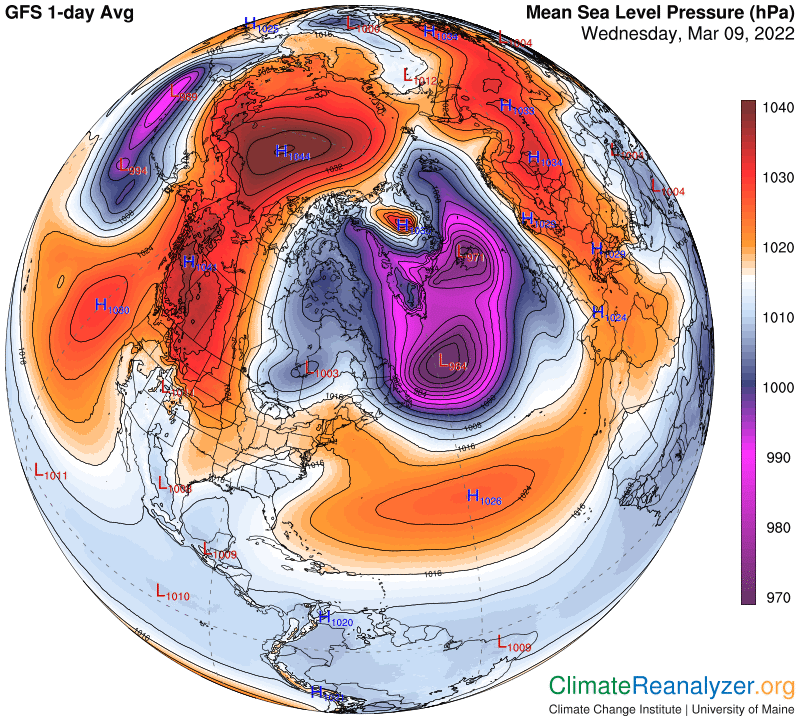
All ARs have a natural inclination to flow toward the pole of the resident hemisphere, with an easterly bias included. They are sure to encounter jetstream winds of one kind or another while making these journeys. Every encounter is bound to have some effect on the course that is followed by the AR stream and also on its physical structure, which is simultaneously being altered by condensation of the water vapor into various end products. The heaviest of these, going beyond clouds, have a natural inclination to precipitate. The end result of all this activity is a widespread scattering of various parts of the PW that make up the composition of each river. The jetstream winds that bring about this scattering have their own features of irregularity, affecting their shapeliness, positioning and intensity. All of these features, like those of any other kind of wind, are largely governed by the structure of pressure gradients in the surrounding air. The daily maps demonstrate how the configuration of upper-level gradients differs considerably from the lower-level configuration. The different shadings on this next image serve as markers, with an extra need for interpretation of the way the isotopic lines are drawn:
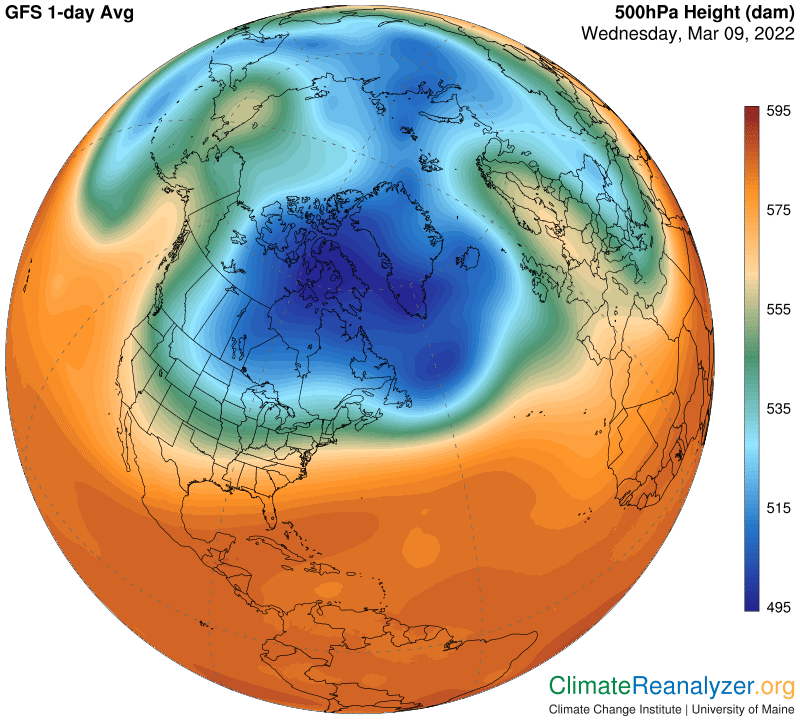
The next map, for comparison, shows the current configuration of air pressure gradients within the lower level of the atmosphere, beginning at sea level. There are some similarities and many differences. The gradients are more clearly marked out on this map:
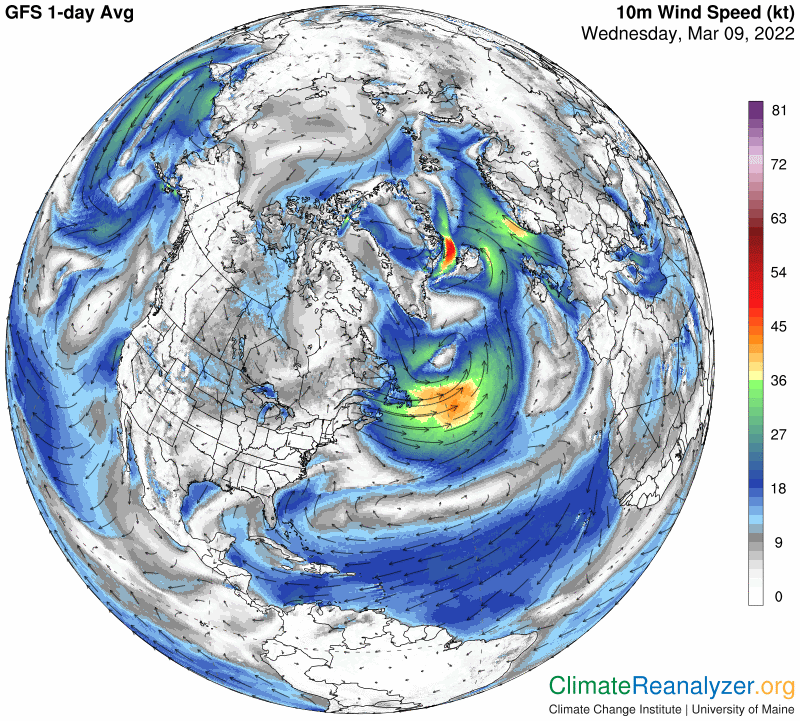
Now for a comparison of how the wind system looks at this level, being governed by a separate set of pressure gradients. These winds, when strong enough, are quite capable of transporting ARs of their own over considerable distances at intermediate altitudes, bringing along precipitation and greenhouse energy effects similar to those generated in the higher level system:
The configuration of high-altitude air pressure gradients is an important factor in climate studies because of its significant level of control over the activity of jetstream winds. Strong winds that hold together in a tight formation generally follow a pathway that makes a wide circle around the entire globe, with the pole near the center and all or most of the either one of the polar zones neatly tucked in with it. Such a circle of wind is very effective at preventing bits and pieces of PW from entering the overhead atmosphere of the zone. Taking the greenhouse energy effect of these bits and pieces into account, their absence translates into cooler temperatures on the surface below. Whenever or wherever the jetstream winds are weak, fragmented or disorganized a higher volume of those bits and pieces will typically be able to penetrate the interior of the zone and cause extra warming to take effect. The effect is immediate. We can see it every day on the temperature map, just as clearly as on the anomaly map:
I have more to say about the formation of high-altitude air pressure gradients, but this will have to be held for continuation in tomorrow’s letter.
Carl