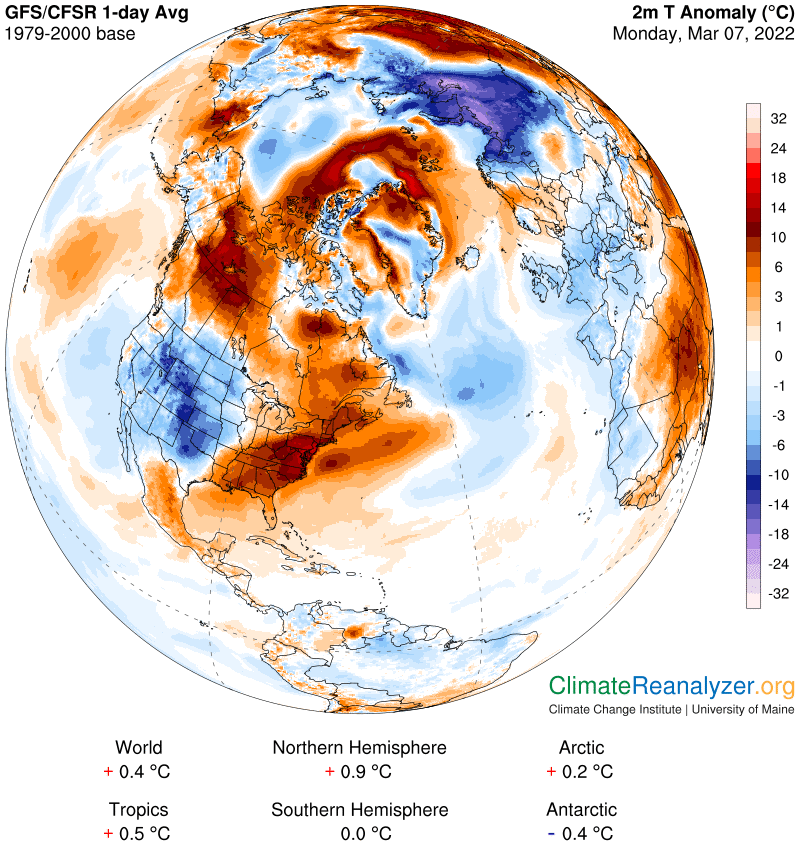
What’s happened to Arctic amplification (AA)? Eight days ago the Arctic temperature average was +4.0C degrees, today a bare 0.2C. This puts it below the global average for a change, instead of up to seven times greater:
The Arctic region has high day-to-day volatility for several reasons. One is because of its relatively small size compared to the entire globe or any hemisphere. Another, because currently almost the entire surface is either land or sea ice, with very little open ocean. Both of these factors add volatility to regional temperatures everywhere. We can add another factor, and this one is special. Of all the things that can cause temperature volatility in any region there is one that always stands out above the others: the way irregular concentrations of precipitable water (PW) are distributed across the skies of any particular region on any one day. This factor is relatively high for the Arctic, especially during the long season of little or no sunshine. On most such days there is not much else going on that can cause temperatures to change. The same factor applies to the Antarctic, but in this respect the Arctic has one additional factor of its own that favors volatility—its relatively flat surface. Antarctica, especially in the most mountainous part, is structured in a way that vigorously holds back the entry of overhead PW components The Arctic has less of this ability. On some days, like today, it successfully holds back PW penetration quite well on overall terms, but still not everywhere. On other days the agencies of defense, largely in the form of jet streams, get shifted around in ways that allow PW to come pouring in from many different directions. Every bit of PW that manages to do so brings along its greenhouse energy effect as a constant partner. Today we’ll look at a small but perfect example:
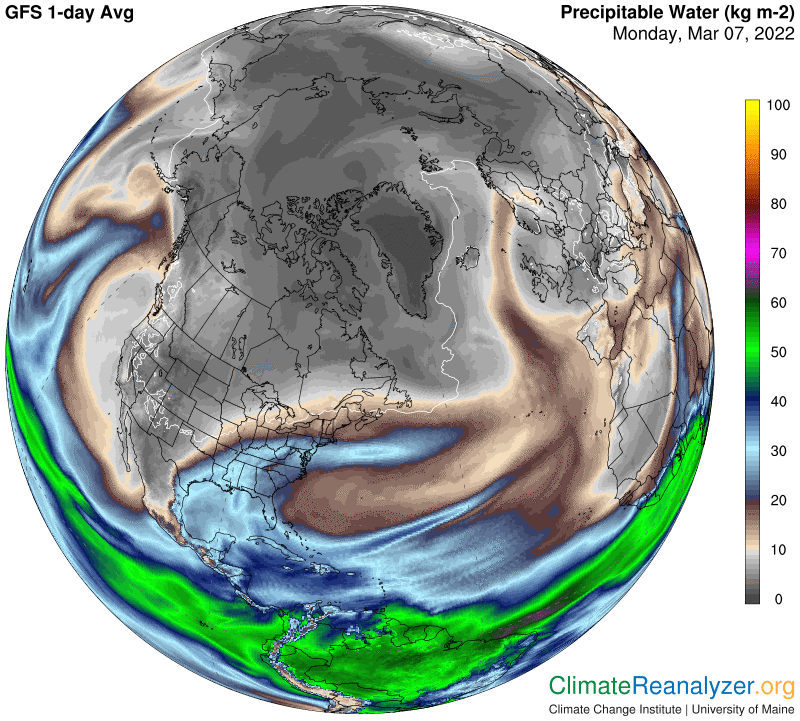
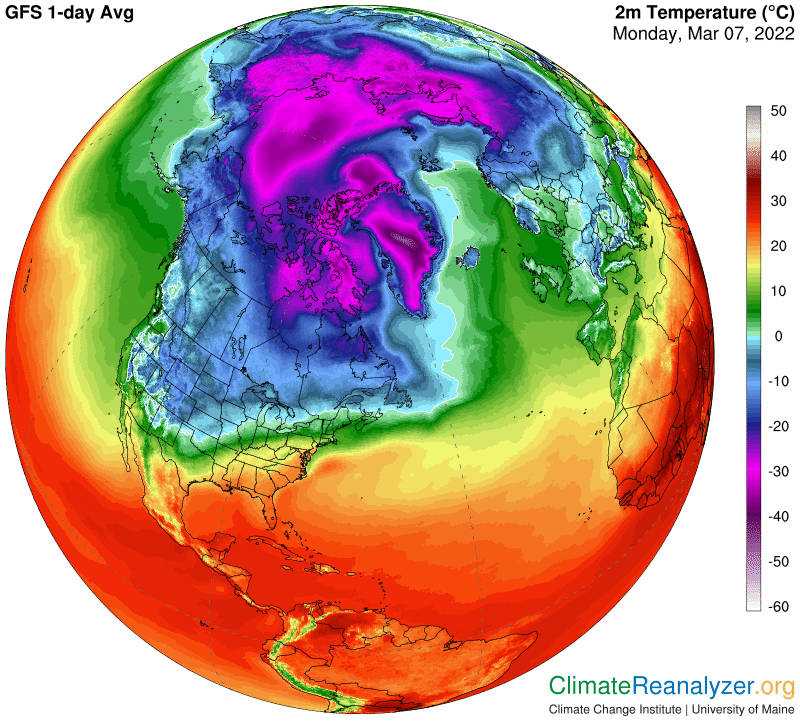
Now, use some magnification and bring your eyes up close to the screen. Focus on the stream of PW concentration that penetrates the ocean area in the vicinity of Svalbard as it angles westward, then passes north of Greenland and eventually heads southward. Now shift your gaze back to the anomaly map. The close match is not an accident. This is a miniature view of how temperature increases are forced by greenhouse energy on a short-term basis. Now look at the kg values coded in the PW stream, and compare these values to those on either side of the streaming PW. The way greenhouse energy works, each double of total PW, in terms of kg (or better yet, grams), traps enough outgoing energy to add about 10C to surface air temperatures. Do you have doubts about that? I’ll open the temperature map. These are the real average temperatures today. They go from -38 or so to -20 in areas of close proximity, for one good reason:
Directly to the north of Greenland you will see a little bulge of frigid air. You will also find a marker of the same presence on the anomaly map. And when you look closely at the PW map you will find a small area of darker shadings in that very same spot. Again, these matches are not a coincidence. They carry a message. Why does that little cold spot with low PW happen to be sitting there? I’m not really sure, but when I look at the jetstream map I do see some peculiarities of weak, “inner circle” stream movement right in that position:
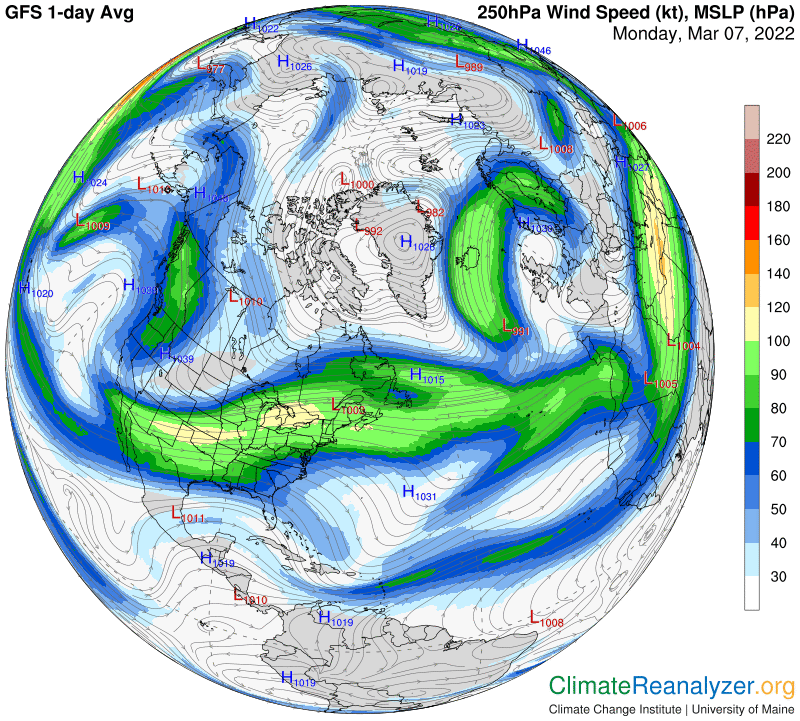
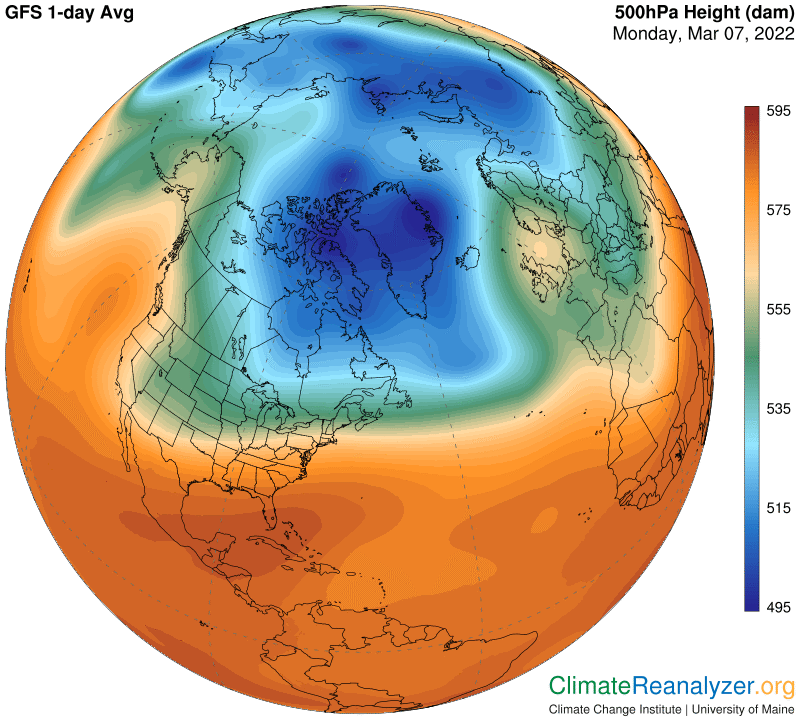
The configuration of high-altitude air pressure gradients is constantly involved as a pacesetter of volatility in the Arctic because of its high level of control over jetstream strength and positioning. In general, the straighter and more regular the jetstream pathways are the greater the likelihood of colder temperatures within the blue zone due to their inhibiting of the movement of PW toward the pole. You can see this relationship at work today on the Siberian side of the Arctic region, where cold temperatures are the widespread and quite intense today:
Carl