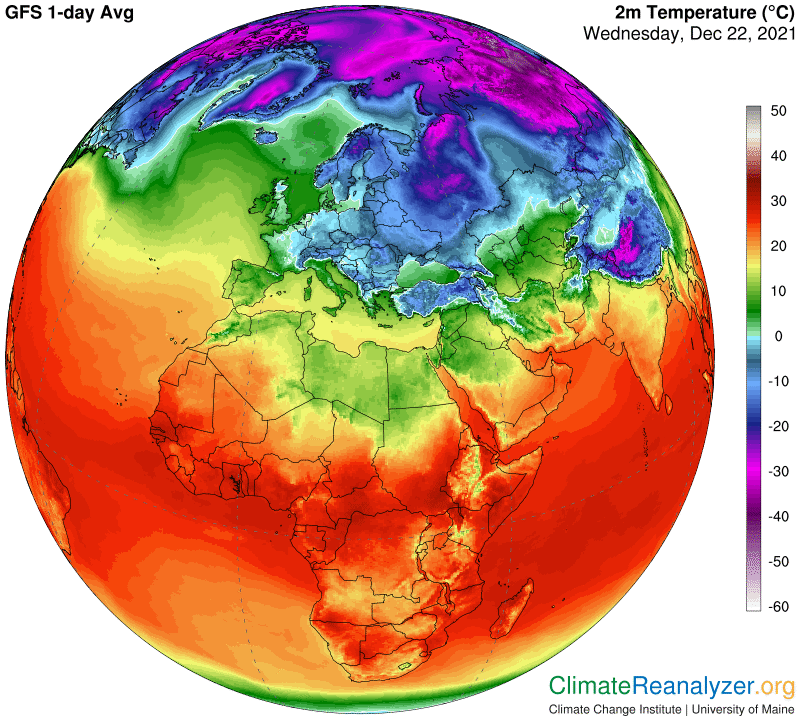
Today we’ll do another demonstration of the greenhouse effect of precipitable water (PW), much like yesterday’s, but with more of a European perspective and with additional commentary on causation. We’ll start with the temperature map. Focus on an especially brutal cold zone, an area having temperatures of -20 to -30C (up to -48F), which has dropped far down from the Arctic into the region that divides Europe from Asia.
What can be the cause of such a development in the first place? I think there are a number of feedback effects involved, one of which is decisive for this particular moment in time. The large cold zone is set up exactly where it is because of the highly distorted shape of air pressure gradient boundaries in the upper level of the atmosphere. The boundaries are marked by borders shaded in light blue and dark green. Both of these borders are usually much more rounded at this time of year, in a way that is more circular while extending all the way around a polar center, but now they are not. The distortion can be attributed to their response to various feedbacks that are all out of the ordinary these days—which I have described in previous letters but will not be detailing today.
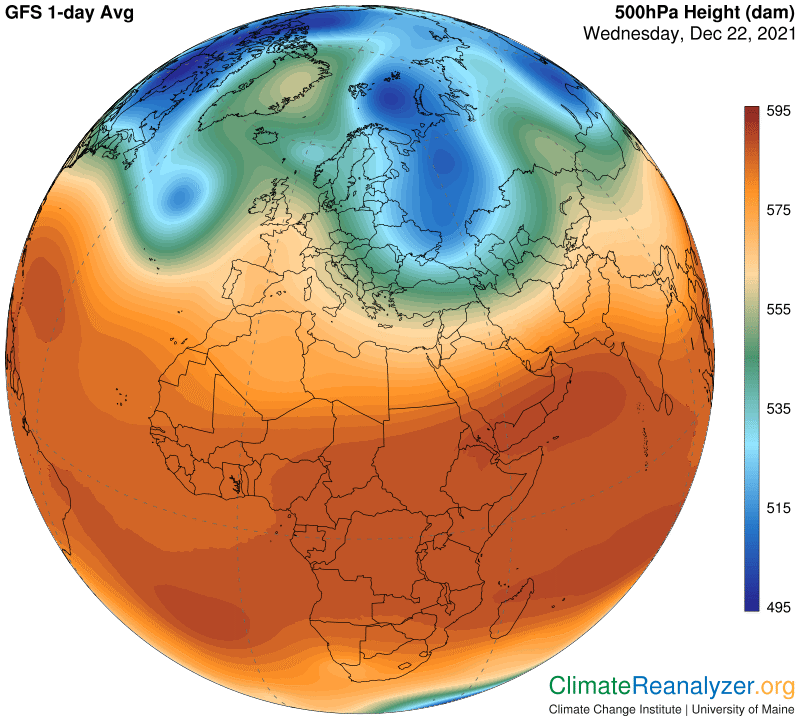
The light blue track in the above image represents the actual pathway taken by one of the four major courses of jetstream winds that roam about in each hemisphere. These courses must stick to their assigned gradients, however they are configured, even when the configuration is as utterly insane as what we are seeing here today. Watch what is happening to the stream of winds that are trying to stay on the track of the light blue pathway:
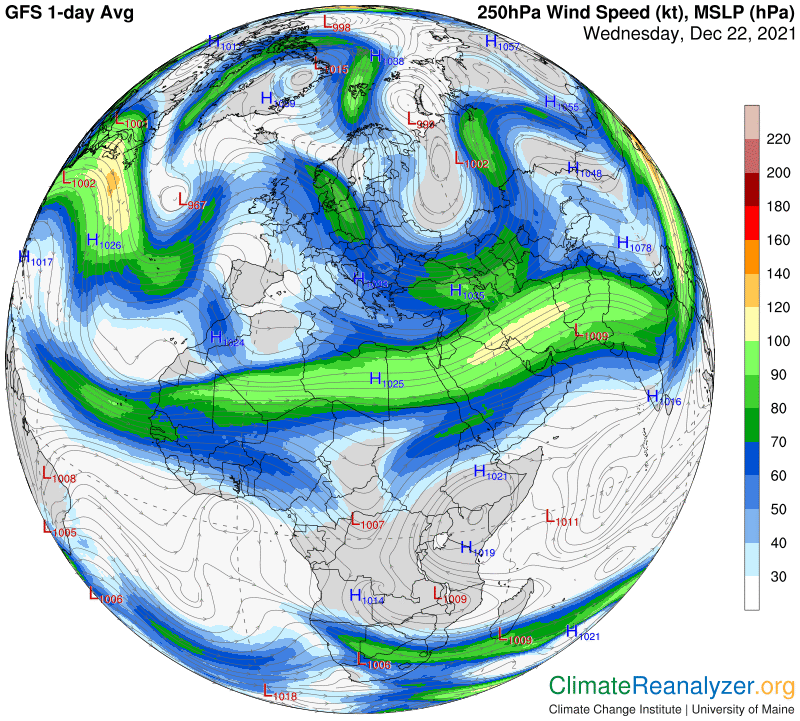
Any atmospheric river (AR) that rises to the altitude occupied by jetstream winds will naturally have its course of progress affected by whatever courses are being taken by any of the major jet-wind pathways. Cutting across the track of winds on the gradient marked by light blue is almost always difficult, especially when they are as strong as they are today. Hence the extraordinarily low PW readings over the geographical region that current underlies the entire big loop that has formed, especially the central interior. Here are the values what we are getting, with almost all of Europe plus the far western part of Asia being at least partially affected:
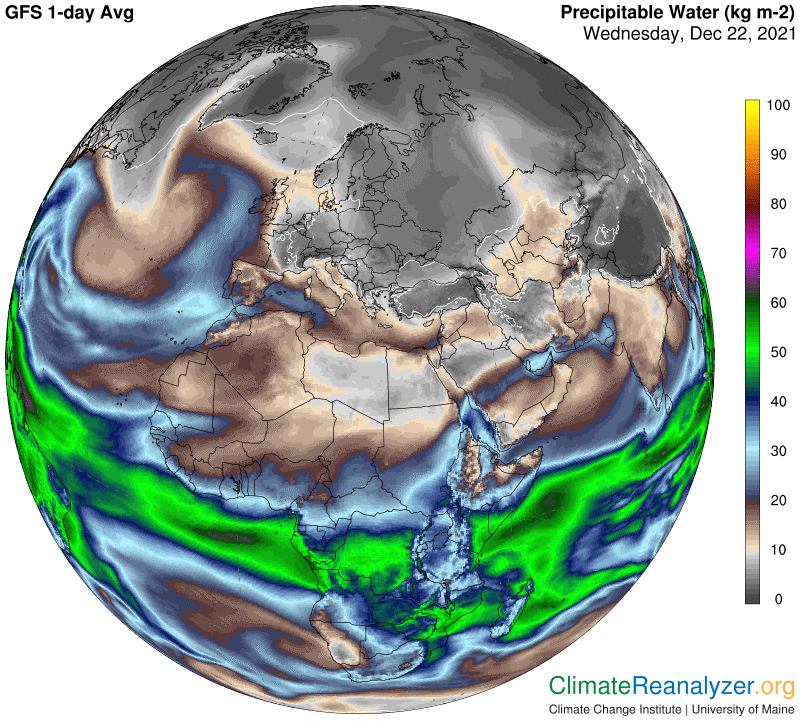
Note the one large area, having a vertical shape, in the heart of the loop we saw above, where PW values have dropped below 2kg. I think they are right on the verge of hitting 1kg because of the weak magenta shading on the temperature map. Anything below 1kg in overhead PW nearly always signifies corresponding surface temperatures below -30C, as commonly observed within the Arctic zone. Next, let’s check out the entire area of cold anomalies for this day that are responding to the large stretch of low PW values as recorded above, and how the warm ones differ:
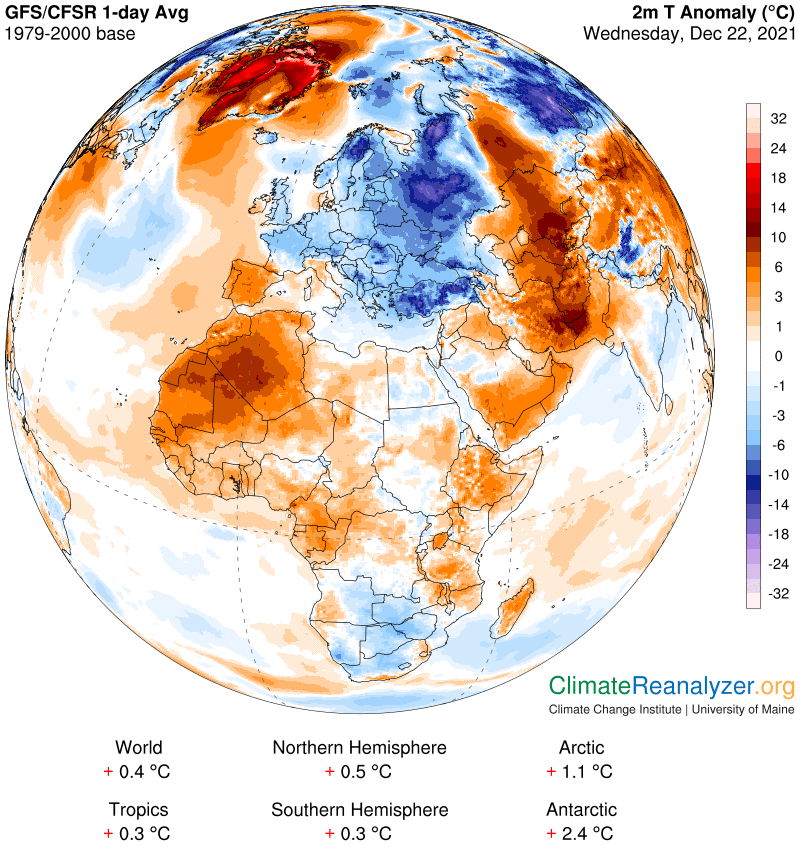
With lots of magnification you can compare the coldest anomaly in far western Russia with the warm one in about the same place where it was yesterday when we looked at it, at the same latitude. I see a maximum temperature difference of 26C (-29 to -3) in two little spots, an anomaly difference of 30C (-17 to +13) in those spots and PW values of an estimated 1.2kg on the cold side to 11.5 on the warm side, which is a little more than three doubles. Not quite perfect, but pretty close, considering the lack of really deep precision in the map numbers.
Carl