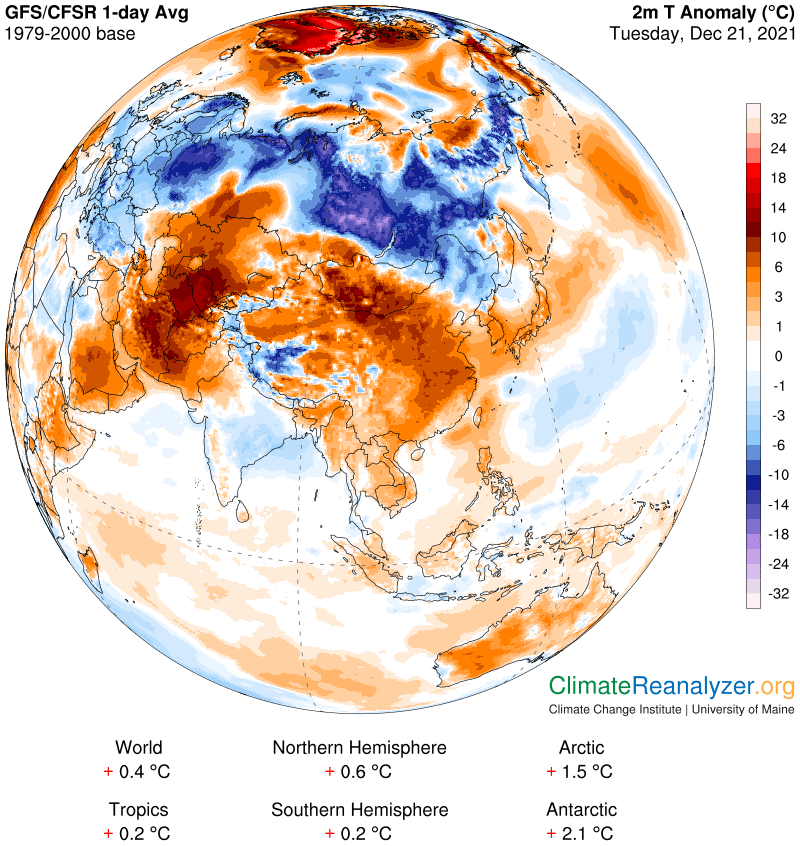
A fine example of the greenhouse energy effect of precipitable water (PW) is going on today in southern Russia. We’ll be comparing two locations that have similar land features, both on the same latitude as northern England. One of them is at least 36C (65F) warmer than the other in average temperature for the last 24 hours. The warm spot will show an anomaly in the +8 to 10 bracket, the cold spot with lows in the unusually extreme -21 to 24 bracket, for an average difference of about 31C. On this map, look for the cold location tied to a group of pink shades enveloped by dark blue a little way north of Mongolia. The warm location is directly west, just off the border of Kazakhstan. You will need to do extensive magnifying to pick out the very coldest of the pink anomaly spots:
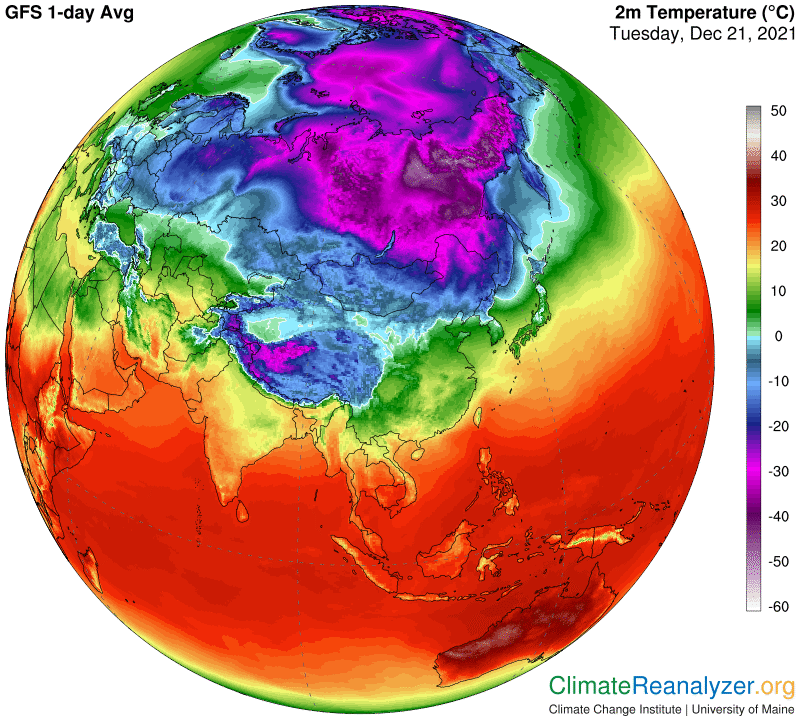
This map has the actual temperature averages, about 0C in the area showing a pair of warm spikes in the west and -36 to 37C in the east in the extreme anomaly spots:
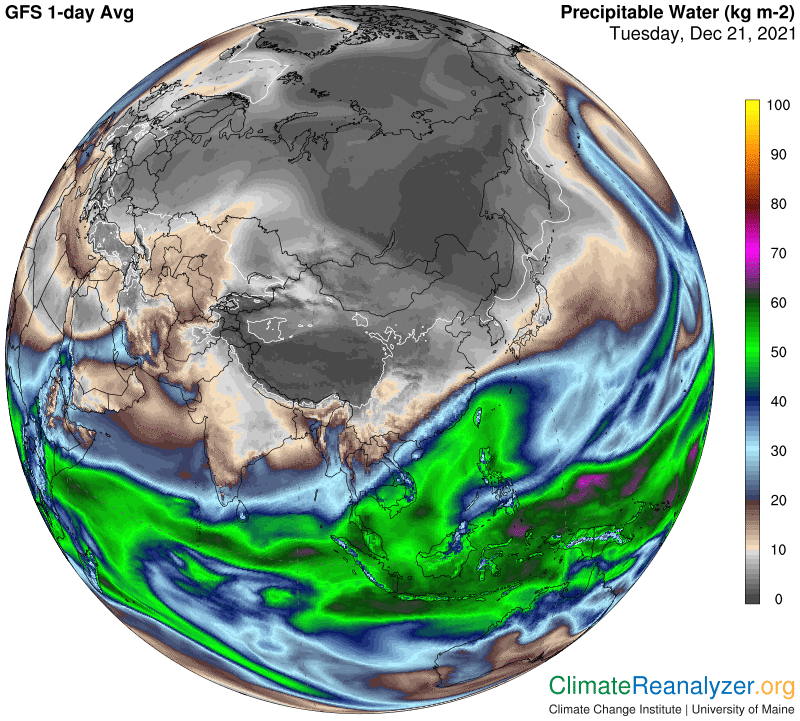
Now for the PW readings. In the west the average is about 10-11kg in the area where the two warm spikes are seen. In the east the the cold spots are within the 1-2kg bracket and also very close to an extension of the 0-1 kg bracket, for a probable interpretation of no more than 1.2kg. You would need to double that number a bit more than three times to reach the 10-12kg readings in the west. Assuming a greenhouse warming effect of about 10 C for each double in PW value, the actual temperature difference measures up very comfortably, with something to spare.
I am thoroughly convinced that nothing other than the difference in overhead PW content in the atmosphere could account for the bulk of the huge temperature difference between these locations on this day, but there could be other factors that might add a degree or two to the anomaly. Solid snow cover is certainly not one of them:
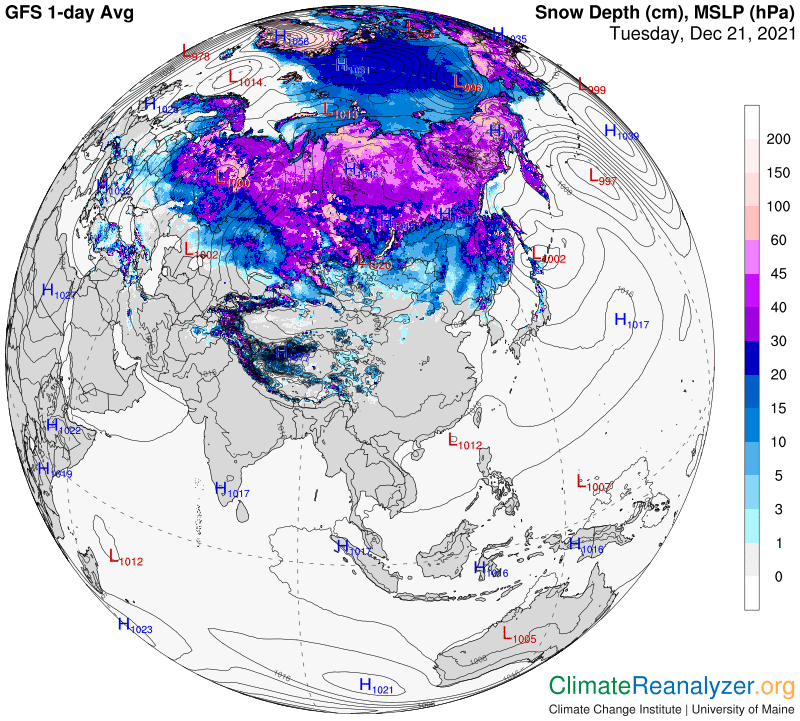
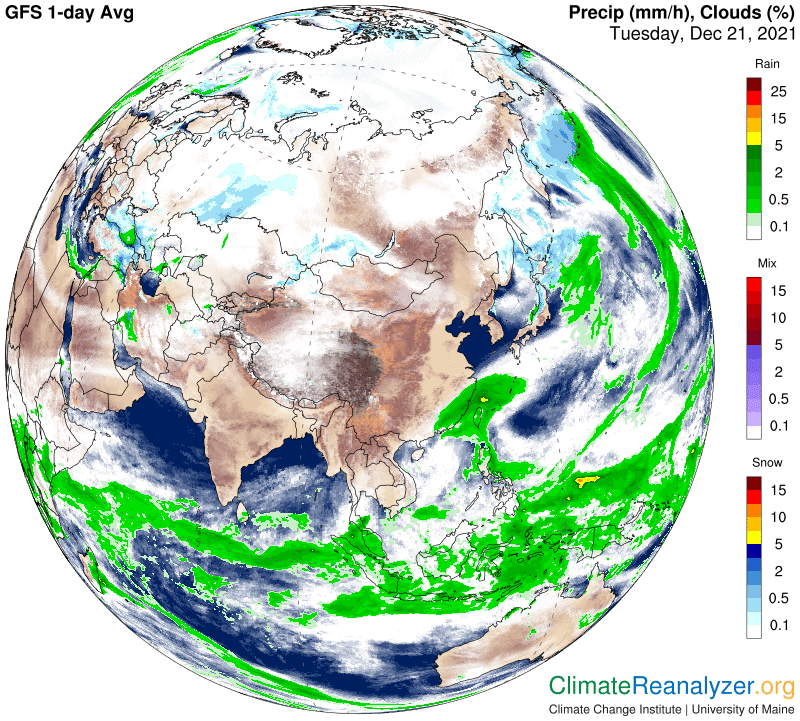
What about cloud cover? This is where things get more interesting. This map tells us that the warm area has been getting heavy snowfall, which means its PW content must be composed of material that includes fairly thick clouds as well as a lot of icy particles that are needed to make the snow—along with a correspondingly reduced proportion of water vapor following its necessary condensation. The cold anomaly, on the other hand, is well within the large area of basically clear sky on the map, which must therefore have a water vapor content of close to 100% in the PW composite. Yesterday I mentioned the possibility that, weight for weight, the condensed components of PW content might actually have a greater greenhouse energy effect than the water vapor component. This situation only suggests that 10C per double may at times be exceeded, which is something to keep in mind that will always cause one to wonder about a valid explanation. (The regular +/-2C margin of error has a number of potential ways of being explained.)
Carl