Another letter (the 3rd) devoted to Hansen’s prediction about the effects of sulfate aerosol removal. Hansen has a record of outstanding accomplishments in climate science, including his past predictions. He is a totally independent thinker, far removed from today’s climate science establishment that controls the messaging we get from the IPCC, which boils down to this: “But there is still time to limit climate change, IPCC experts say. Strong and sustained reductions in emissions of carbon dioxide (CO2) and other greenhouse gases, could quickly make air quality better, and in 20 to 30 years global temperatures could stabilize.” If all of this is accomplished average global temperatures are still expected to reach 1.5C by mid-century before stabilizing.
Hansen disagrees, saying that the IPCC is not taking proper account of the effect of all the sulfate reduction that would go hand-in-hand with a major reduction in the burning of fossil fuels. How important is that effect? Here is what he says in the July Temperature Update (http://www.columbia.edu/~mhs119/Temperature/Emails/July2021.pdf), where we read: “It follows that the global warming acceleration is due to the one huge climate forcing that we have chosen not to measure: the forcing caused by imposed changes of atmospheric aerosols…..It’s a shame that we are not measuring the aerosol climate forcing to take advantage of this vast geophysical experiment to improve our understanding. The human-made aerosol forcing is almost as large as the CO2 forcing, (my ital) but it is of the opposite sign, i.e., aerosols cause cooling.”
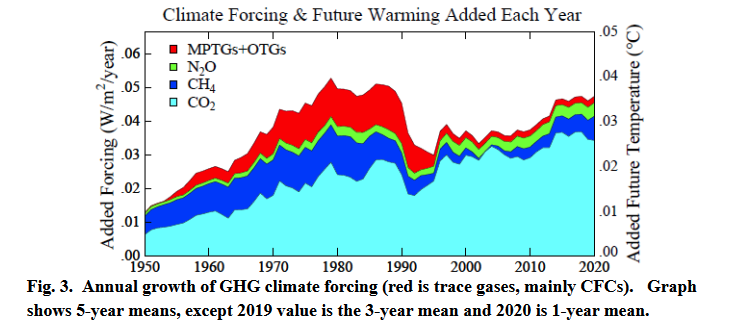
The following chart, taken from the same July update, shows that the annual warming due to all greenhouse gases (water vapor effects are added to those of CO2) is no greater today than it was in the 1970s and ’80s. CFCs were a huge factor at that time, probably more than most of us realize, before being almost eliminated around 1990. Methane emissions have also tapered off but are now coming back. CO2 (including water vapor) has made steady additions to warming, now up to a level of about .026C each year according to the chart. This means the current cooling effect of aerosol forcing, according to Hansen, must still be somewhere around .02C per year, probably a bit more, following a long-term decline from a considerably higher annual effect (perhaps .04 to .05C?) fifty years ago. My .04 to .05C guess has no reference for backup, but it would be enough to offset all of the high GHG forcings in those early years with its cooling impact. And now the cooling effect is likely to keep right on dropping toward zero as we proceed to eliminate the burning of fossil fuels.
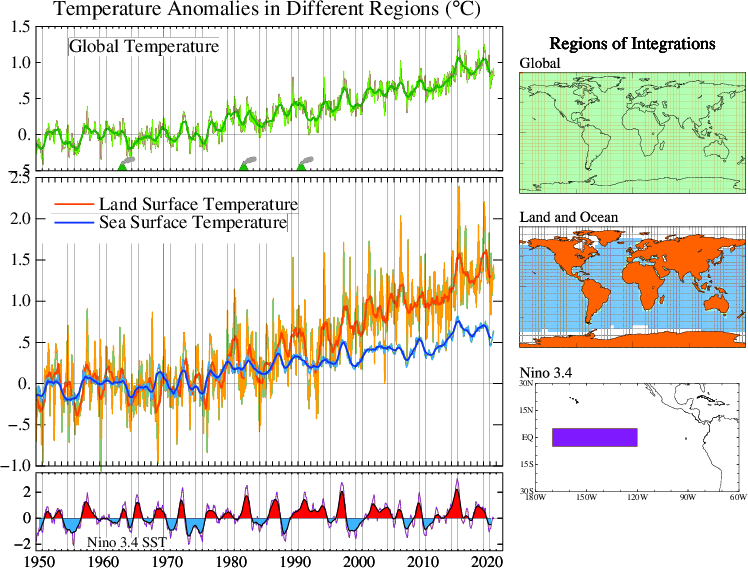
In the top part of the next chart we see what happened to global temperatures before 1980, a period when GHG forcing and aerosol forcing were both rising at rapid rates. (Keep in mind that sulfate aerosols and their cooling effect are mainly created by the burning of fossil fuels, not because of gases like CFC that are produced in other ways.} The current temperature uptrend began after 1975. In the period since then CO2 forcing has grown at a slower rate, and the methane trend has been irregular. Sulfate aerosols still have quite a cooling effect (see discussion above) but it has steadily declined because of regulatory controls. A net decline in cooling from .045C per year to .025C translates into additional warming of .02C each year, which is about what we see for the total on this chart over the past 45 years.
I’m going to postpone the finishing of today’s letter because I feel like something is missing, and want to give all these numbers more thought after taking a good break. See you Monday!
Carl