Continuing my commentary (see the last three letters) on James Hansen’s truly unique report and predictions published in July. I have been giving it a lot of thought. Hansen has been a life-long student of aerosol effects on climate, which is hampered by a lack of the best data, and he has certainly come up with some interesting conclusions. One takeaway that I find most fascinating is this: “The human-made aerosol forcing is almost as large as the CO2 forcing, but it is of the opposite sign, i.e., aerosols cause cooling.” (Elsewhere, he specifically singles out sulfate-type aerosols, and explains why.) Let’s consider the implications. First, I believe he is evaluating the relative status of these two opposite forcings as it stands today, following a fifty-year long period marked by major reductions in the sulfur compounds emitted by burning coal and fuel oil, the two primary sulfur contributors. The implication is that prior to 1970 the status was probably reversed. The cooling effect of the sulfur dioxide (SO2) emissions from these two fuels at that time must have been considerably greater than the warming effect of the carbon dioxide emissions produced by these same two fuels. That has never been very noticeable, because two other greenhouse gases, CFCs and clean-burning natural gas (methane), were rapidly growing at the same time and about able to make up the difference. The only problem was the unbearable pollution generated by the sulfur output. It had to be cured.
What this tells us is that for literally all of the 220 “post-industrial” years prior to 1970 the primary source of CO2 growth was also generating the SO2 growth that had a net cooling effect on the climate. And both kinds of kinds of emission gases were always being created in tandem. Whenever one moved up so did the other. So for well over two centuries CO2 growth was unable to produce its normally expected warming effect on temperatures because by far the largest part of its growth was of a most unusual sort—for reasons that caused CO2’s effect to be automatically cancelled out and probably even reversed. What can we learn about this peculiar circumstance from actual temperature records?
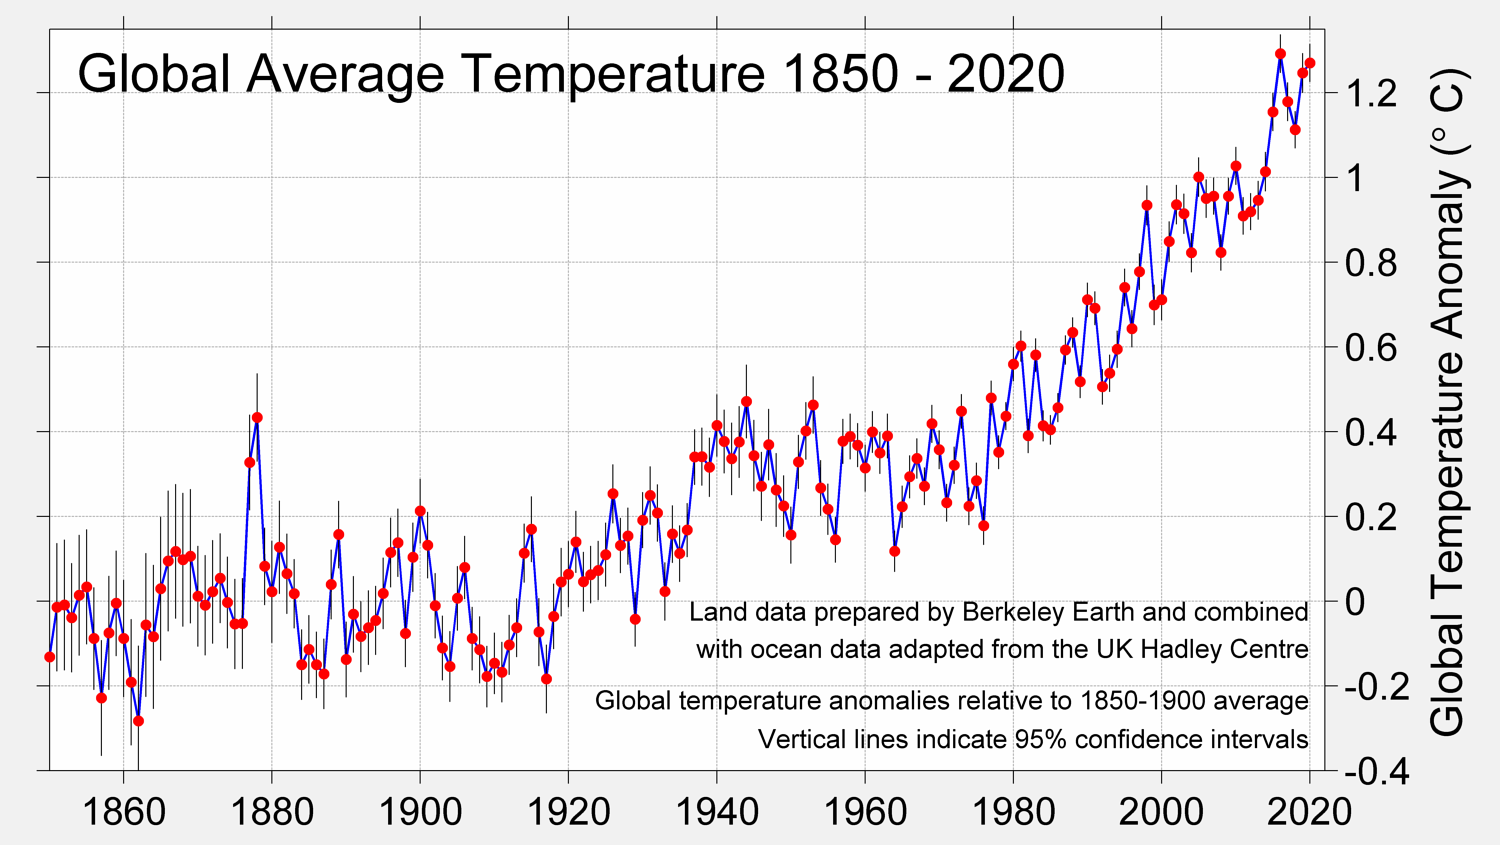
Sadly, actual records and credible reconstructions of global temperatures do not even begin until about 1850, but at least we can start from there. and the chart below should be as acceptable as any. I see little evidence of any uptrend at all in global temperatures for the 70 years prior to 1920. The brief rise that followed is something of a mystery, but not so for what happened next. The lack of any temperature increase from the mid ’40s to the late ’70s, which happened in spite of rapid growth in a number of greenhouse gases at that time, can only be attributed to the memorable effects of extremely heavy sulfur pollution from coal and oil burning in the postwar recovery period.
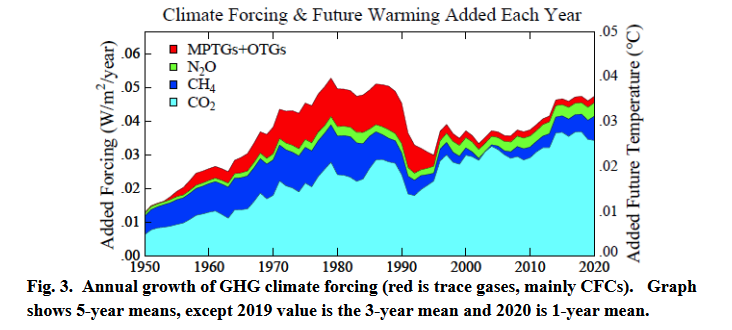
Hansen’s ideas point to a strong possibility that the cleanup of this pollution, getting underway in earnest in the 1970s, could account for a major part of the warming trend that has occurred ever since. As he argues in his report, and as we can see on the next chart (repeated from Friday’s letter), there has not been any total growth at all in the combined heating effect of all the important greenhouse gases over this entire period. The two cleanest ones, methane and the CFCs, both tapered off, especially the latter. Methane’s contribution to the decline was smaller, but is still advancing at a slower pace than it was in the ’80s. remained that way until the past decade. CO2’s underlying growth is intact, but lacking in acceleration until just a few recent years. There is no chart data that can inform us with real numbers showing yearly declines in the amount of cooling caused by the sulfur pollution cleanup, but I can see how these numbers could be surprisingly large when the starting point of the effect in 1970 was so high. Hansen’s claim may not be easy to prove, but at least it seems plausible. Cleanup activity is the primary cause of the warming trend!
Now, what about the next two or three decades, the time frame where Hansen’s prediction will be on the table? His explanation is found near the end of the July report, which requires very careful reading and is still difficult to understand because the concepts he employs are on the esoteric side. The site for reading, once more, is http://www.columbia.edu/~mhs119/Temperature/Emails/July2021.pdf. Hansen sees more cleanup of sulfur emissions coming, which is quite understandable and would probably by itself extend the current uptrend of warming during a period when the CO2 level is still rising. He also contends that we have not been receiving the full impact of the warming result created by the reduction of albedo cooling effects. The extra heat is shown to be coming from solar energy, which helps to make his point, and a goodly share of that energy is passing directly into subsurface ocean waters, where it adds heat content and causes an imbalance in Earth’s energy exchange with space. This heat will not affect air temperatures until the imbalance is corrected by having a net amount of energy emerging from storage and flowing away from the surface at some point. It will happen, but one can still wonder about how certain the timing will be.
Carl