Today the weather maps are giving us a fine opportunity to demonstrate the powerful impact of precipitable water’s (PW’s) greenhouse energy effect on surface air temperatures, plus several other fundamentals employed in the construction of Carl’s theory. This time we turn to South America for evidence, where we are seeing a nice, sharp break in land temperatures having a latitude of about 15S as its point of separation:
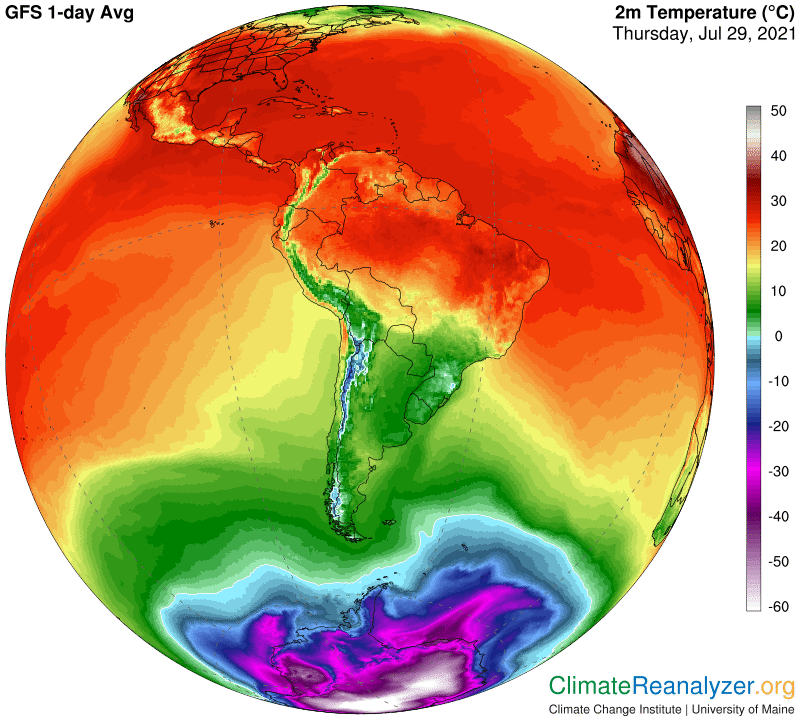
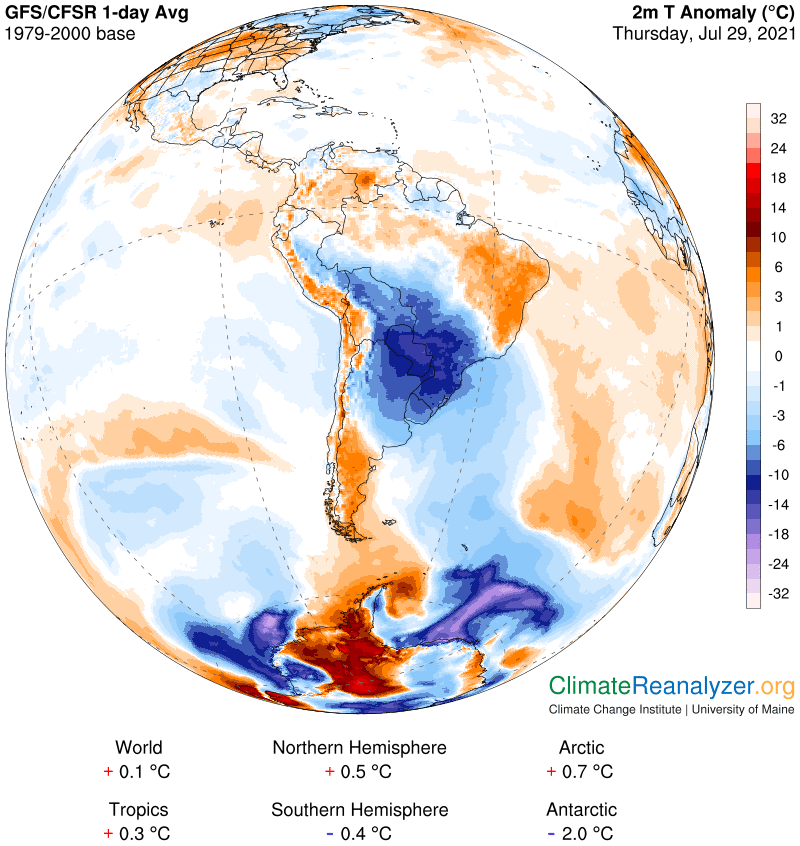
The result is near normal for temperatures in the north, while a massive cold anomaly is covering more than half of the southern half of the continent. A fairly large chunk of the anomaly has a reading of 15C below normal—a most unusual figure for any surface this tropical:
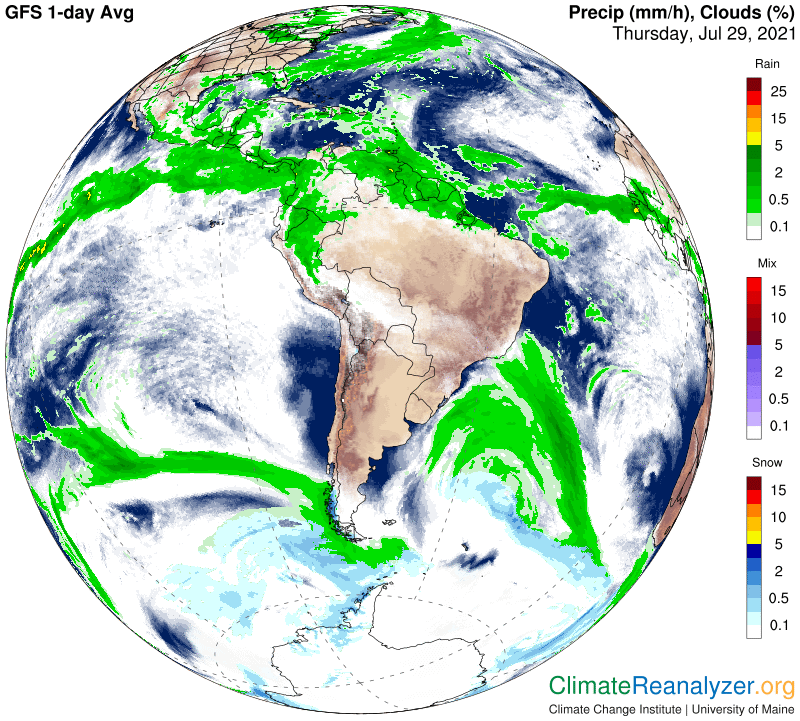
Unlike almost all the cold anomalies we are now seeing in the NH, only a small patch of this one, mostly over Bolivia, can be attributed to cloud cover. Otherwise clear skies are dominant :
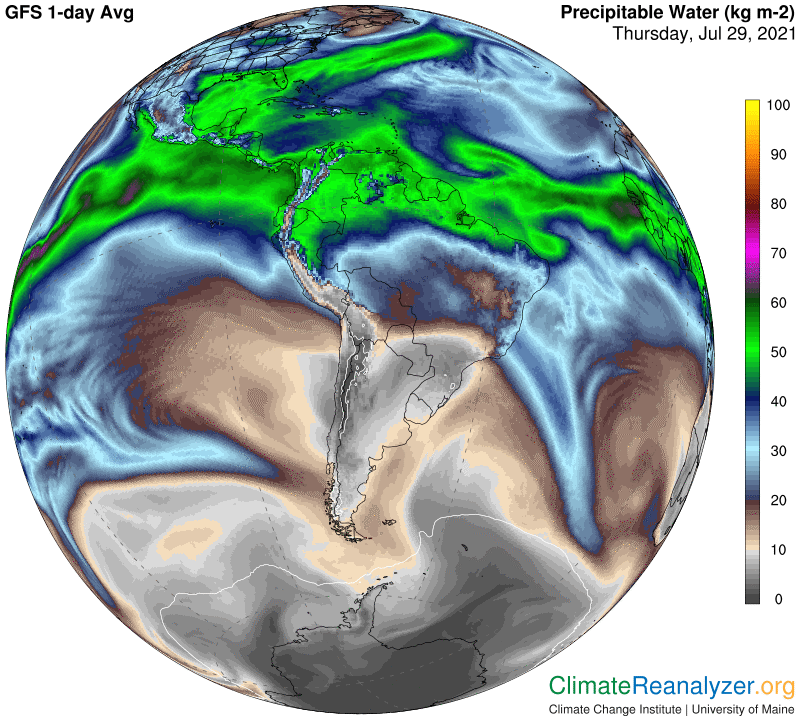
This leaves us with PW as the most likely explanation for the deep cold, which in this case means the current value must be far below the historical average for the day. The next map gives a good reading of today’s values all over the continent, but once again we are frustrated by a lack of the kind of historical data. We need the ability to compare the size of PW anomalies with the size of temperature anomalies to see how well they match. What we see here is a mix of PW values that run from 10kg at the anomaly borders to as low as 3 kg in the center. Immediately above the temperature dividing line we quickly see readings in the 20s, much more than doubling the average of perhaps 6-7 kg in the cold zone, while not doing much of anything in the way of unusual warming. I think “normal” PW in the cold zone, if accurately established, would probably be around figures in the 15-18 range, or most certainly way above what we are seeing today.
Is there a good explanation for why PW values are so low on this day over the entire lower half or the continent? The existing pattern of jetstream winds should give us some clues, according to Carl’s theory, because of the enormous influence these winds are observed to have over the freedom of movement of PW concentrations that have found their way into the upper part of the atmosphere:
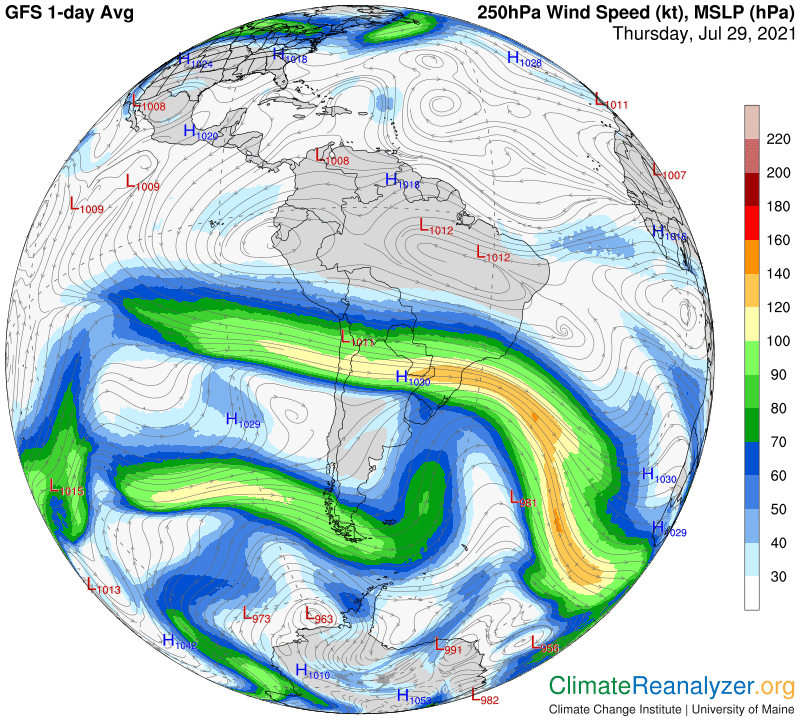
The wind in the enter, in addition to its great velocity, is perfectly positioned for preventing any movement of PW vapors in the upper atmosphere, like those that have risen out of the Amazon rainforest, from heading poleward, as they usually try to do. They still do, but now this PW stream, as seen in the previous image, is being steered by the jets onto a course well to the east, out over the Atlantic. The continental land is left with practically none of its more usual warming benefit. So—why are these jet winds behaving this way, if it is not a normal thing for them to do? According to Carl’s theory their position and strength are both governed by existing air pressure differentials in the upper atmosphere, exactly as depicted on the daily “500 hPa” weather map:
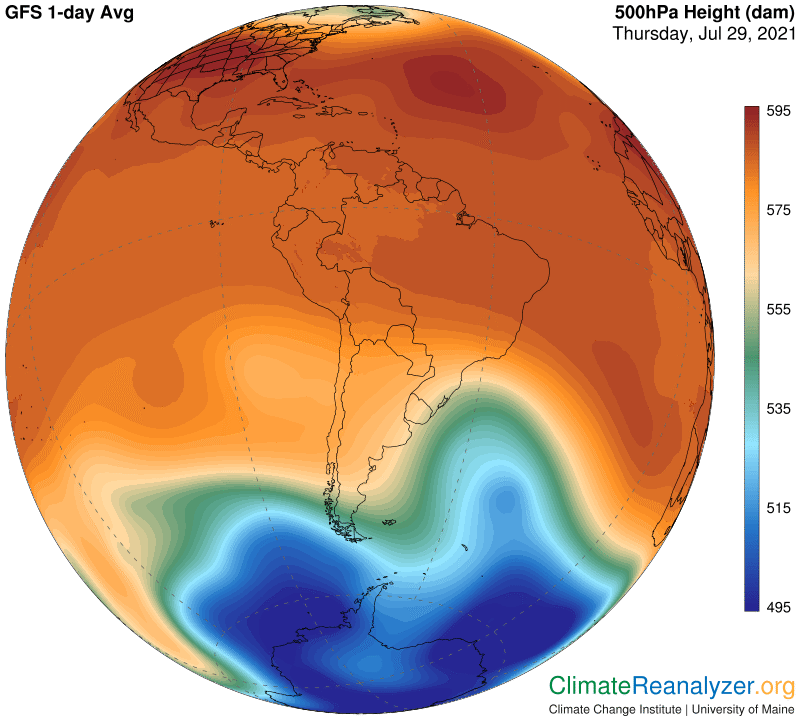
By transposing the imagery, I can see two jetstream pathways, both located deep within the red zone, that often come close together and reinforce each other’s velocity, as they are doing here. They both bear winds cutting straight across the continent before abruptly making a bend and heading south. They are on a track that exactly follows the most visible shift in red shading on the configuration map, which is nothing other than a colorful way to display the location of the isobars. It will all be a little different on tomorrow’s map, but the same rule will apply to jetstream pathways.
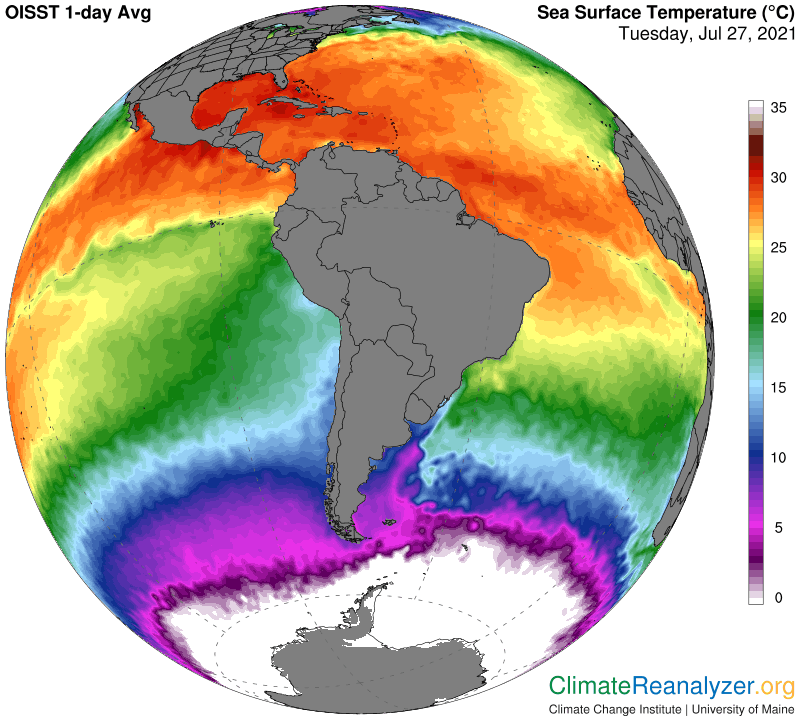
One more point should be made about this particular jet. We know it is picking up and carrying off a substantial amount of vapor from the rainforest, but there is no sign of any similar transport of vapor from off the surface of the Pacific. The next image offers a reason for why not, because the surface of the Pacific, far to the west of the continent and all the way up to the equator, is simply too cool to deliver any significant amount of fresh evaporation to an altitude at the height where jetstream winds are operative. The La Nina conditions now in effect are largely responsible for the surface coolness and will before long revert to a warmer El Nino status. We can still wonder about what kind of future the Amazon rainforest will have as a supplier of upper-level PW given the rate of destruction that is going on.
Carl