Severe wildfires are burning in a well-forested northern section of Siberia, in the state of Yakutia. This story in the link tells about bad they are and how they have hit with “increasingly ferocious intensity” over the past three years: https://phys.org/news/2021-07-homeland-volunteers-siberia-wildfire.html. Temperatures along the Arctic coast of Siberia have not approached the dramatic highs of last year, which reached almost 100F, but there has been no lack of major wildfires and the season is not yet over. Yakutia is experiencing a temperature anomaly of up to 17C (31F) today, the highest of any place in the world outside of Antarctica, where crazy extremes are an almost daily norm. Here it is how it looks on the map:
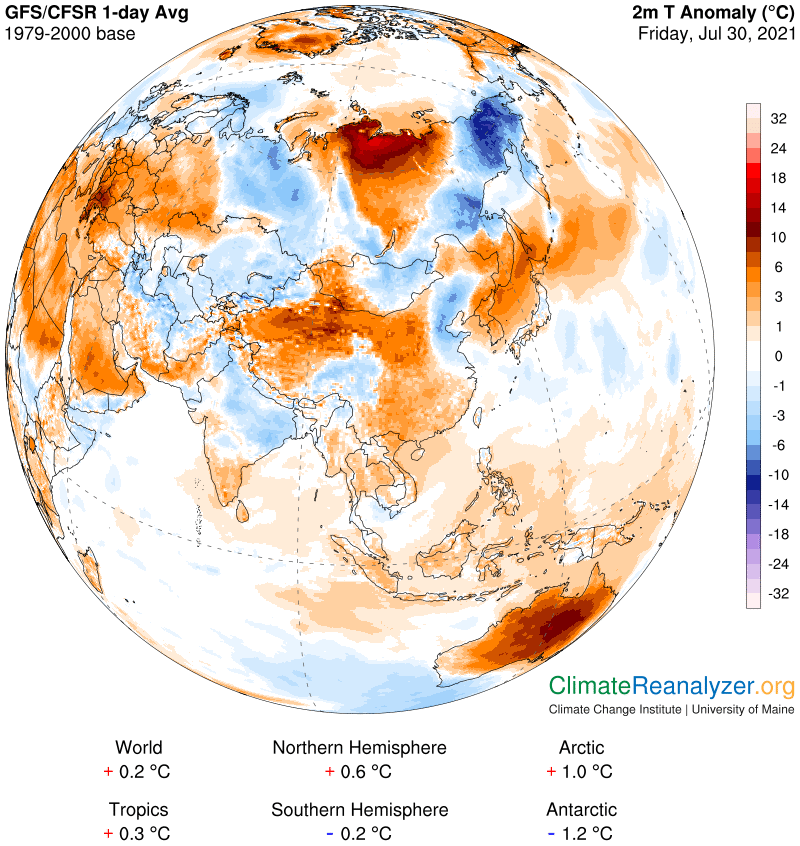
Notice how this warm region is surrounded by a set of cold anomalies. The one directly to the east measures out with a drop of 11C (20F) below average. The big picture suggests that something strange must be going on. The first map I turn to these days is the one that shows clouds and rainfall. It contains just about everything I could have expected, with a couple of exceptions, one of which will be saved until the end.
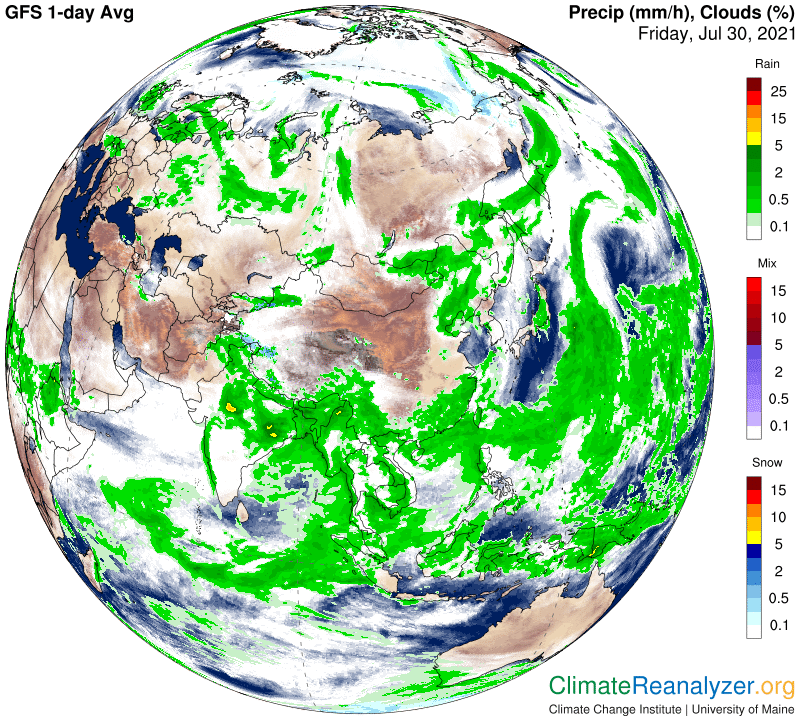
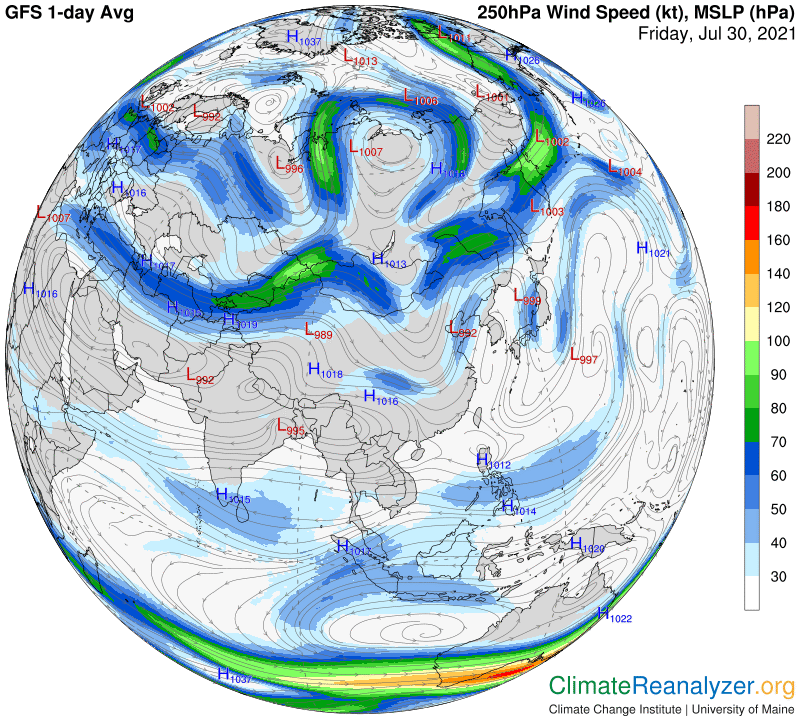
Clouds associated with heavy rainfall are moving into central Asia from three different directions. In ever case they are having the expected effect of pronounced cooling on surfaces below. The next image demonstrates without doubt that many of the rainclouds are being carried in by jetstream winds in the upper atmosphere, but its not clear that this is true for the clouds that appear to be approaching from the south. It seems possible that they are being moved along by winds at a lower level, but either way the effect on temperatures makes no real difference.
Now let’s have a look at the precipitable water (PW) map to see what it can tell us about this situation. It looks to me like wherever there are rainclouds the atmosphere is holding at least 20kg of PW and often much more. That makes sense, but does not imply that 20kg needs to stand as some kind of minimum. It’s also clear that the higher concentrations of PW sometimes produce rainclouds and sometimes do not, often leaving the skies with no clouds at all. What are the reasons for so much difference?
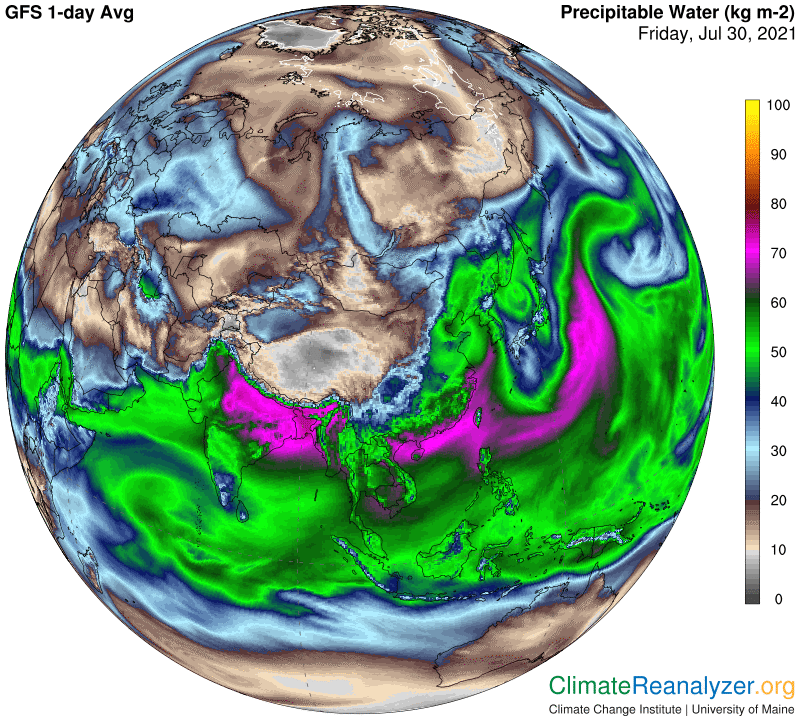
The Yakutia anomaly of +17C in the first map is seen here with PW values in the mid to high 20s for kg and a perfectly clear sky. In the area directly to the east of it we see PW values that are quite a bit lower, a presence of rainclouds, and a cold anomaly of minus 5-6C. Here is something even more interesting, about the cold anomaly exception I mentioned in the beginning. This applies to the spot where the -11C anomaly is found. It was not caused by rainclouds but mainly by a distinct shortfall of PW in the atmosphere. You can see how this small patch has had incoming flows held back for some reason, resulting in a PW reading that averages no more than 9kg. I believe the contrast in PW values, when compared with Yakutia, is large enough to account for most of the 28C difference in temperature anomalies. The remaining difference could be attributed to the presence of overhead clouding , but an absence of any rain, that can be seen for the cold spot on the second map..
Carl