In today’s letter I want to bring a new level of clarity to a natural process that enables air temperatures at the planetary surface to cause changes in the movement of precipitable water (PW) concentrations that exist high in the upper atmosphere—which in turn have a pronounced effect on air temperatures at the surface, with the result being a self-reinforcing feedback loop. The producers of Today’s Weather Maps made some improvements over the weekend in the scale of color coding used to depict the temperature changes, resulting in a higher degree of clarity for thse numbers. The natural process involved is the same in the Northern and Southern Hemispheres, but the outcomes are completely at odds. One polar area is steadily growing warmer from a historical standpoint while the other is cooling. I will try summarize the main cause of these differences by comparing just four images . This will take a lot of images, so please hang on. We’ll start with the north, with a map of today’s average air temperatures:
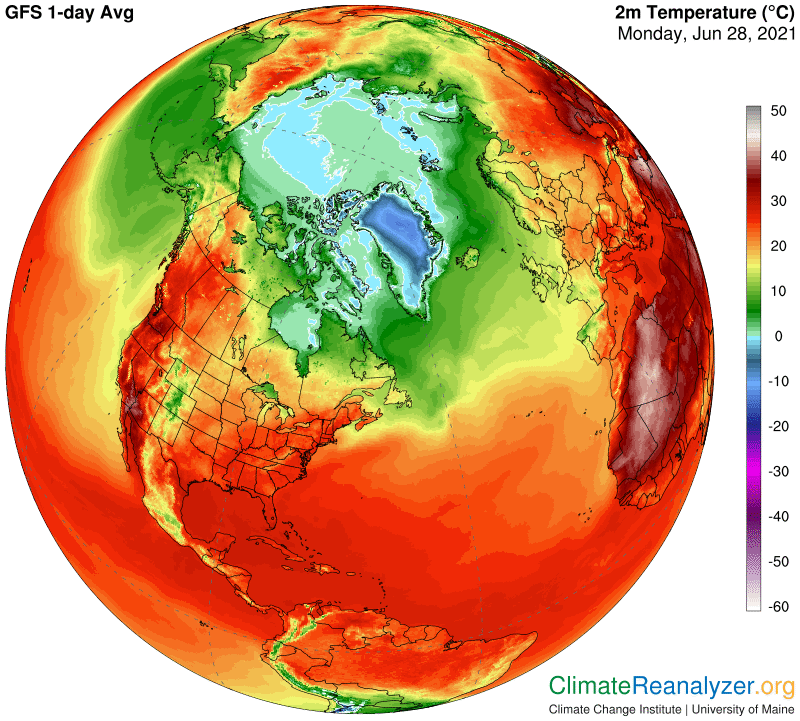
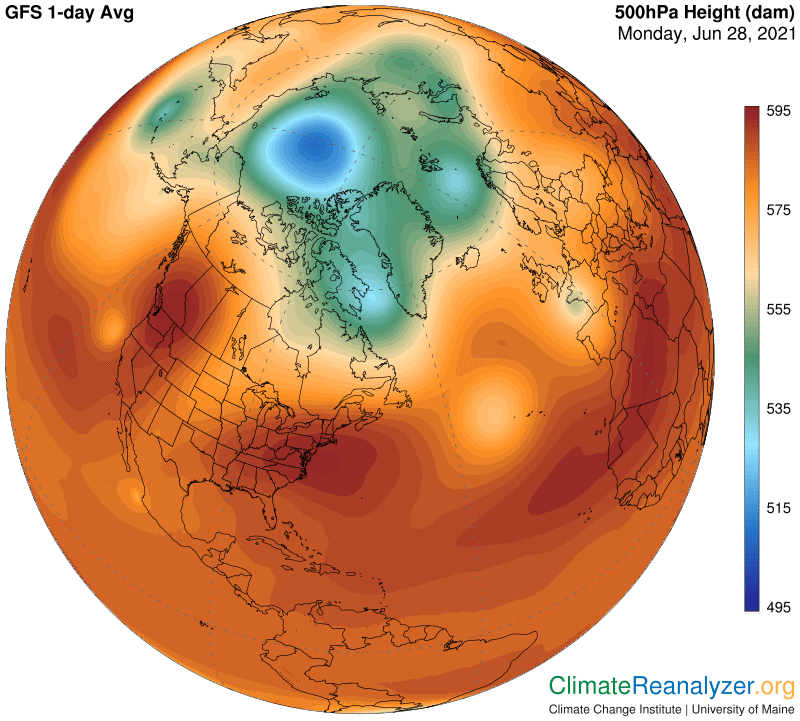
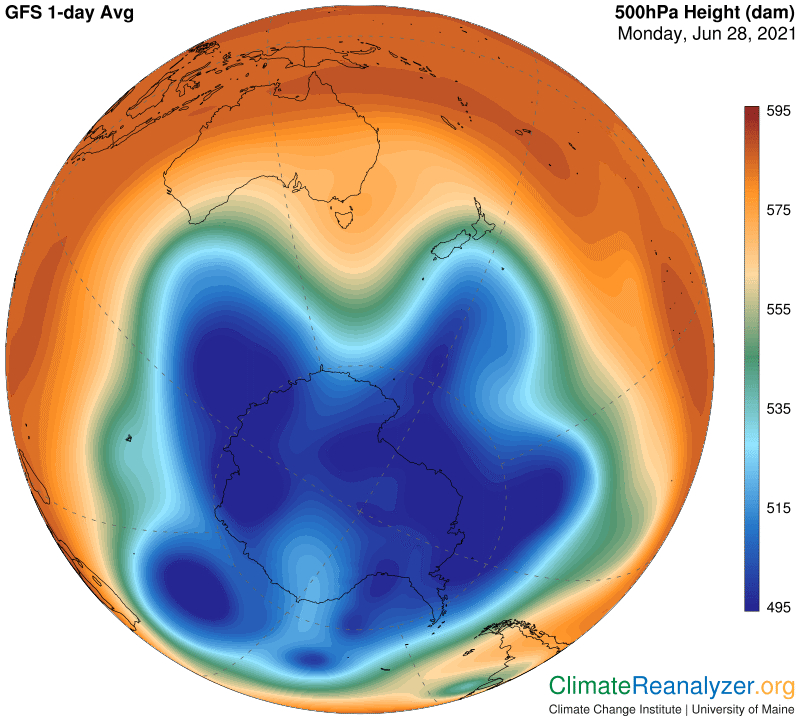
Note the large patch of light blue in the Arctic Ocean. Outside of Greenland, which is a very special case because of its altitude, every other region of meaningful size is now above zero. Next we’ll open the map showing air pressure configuration at an altitude of 500hPa, a pattern which only begins to take effect at an altitude about 3 miles above the surface. The zonal shaded in dark blue represents an area enclosed by isobars that can only form when temperatures directly below are below freezing. Such temperatures are rapidly disappearing in the north, partly for seasonal reasons and partly because of an assortment of other things related to climate change that are also warming the surface. When the blue zone is gone, which is expected within a few weeks, so will the specific jetstream winds be gone that would otherwise surround the zone on its perimeter. Away from the blue zone we see a green zone that sets up in exactly the same way except that it only forms when surface temperatures directly below are between zero and about 10C. This zone has been shrinking in total size, but is in no current danger of completely disappearing.
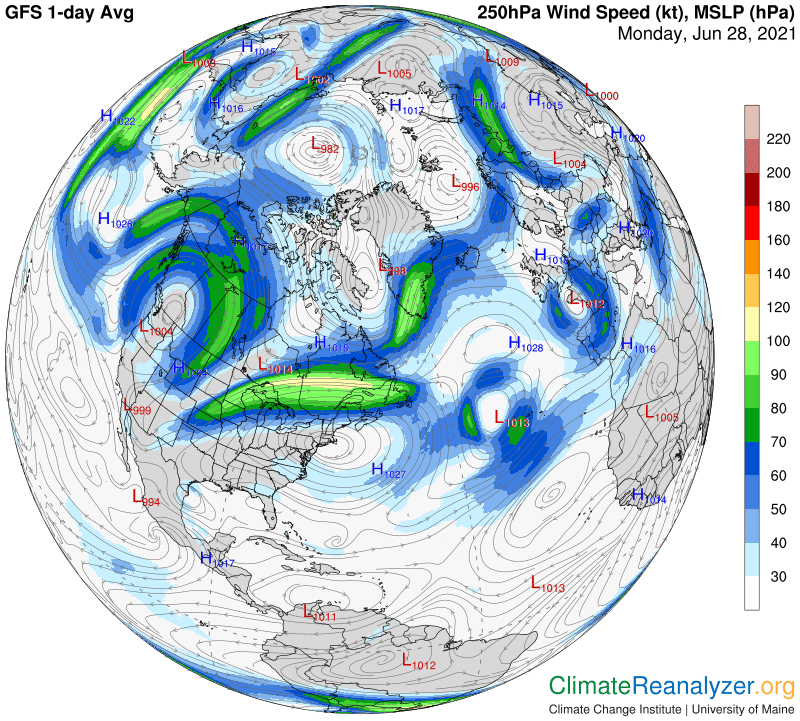
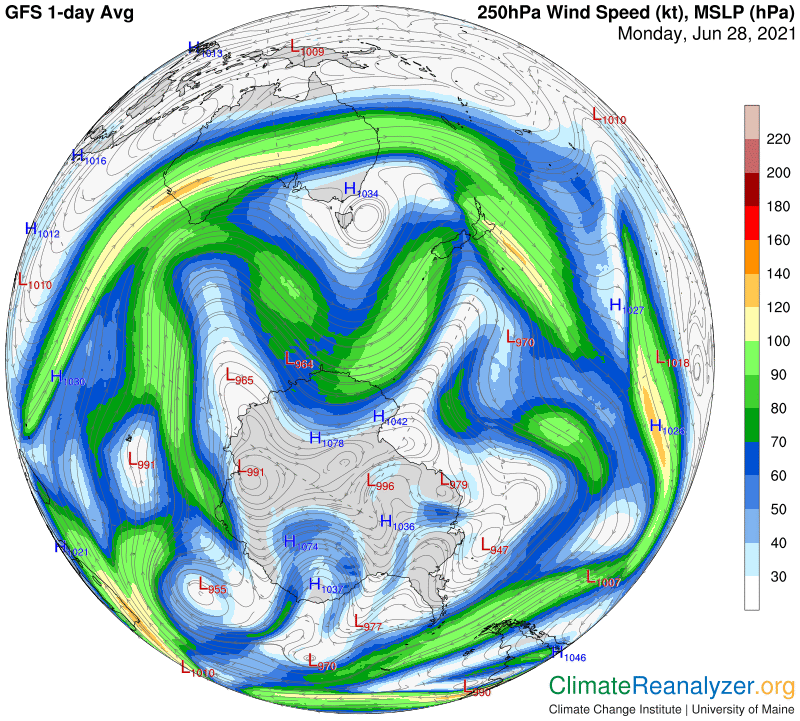
Next we’ll open the jetstream map, where we the first thing we observe is nothing more than a hint of winds surrounding the blue zone. The green zone also has a specific wind pattern that follow a pathway around its perimeter, which are in view but necessarily quite scrambled at this time because of all the distortions in the layout of the perimeter isobars. The remaining jets that are portrayed on this image all track along isobar pathways contained within the red zone. They have less pertinence for today’s main story.
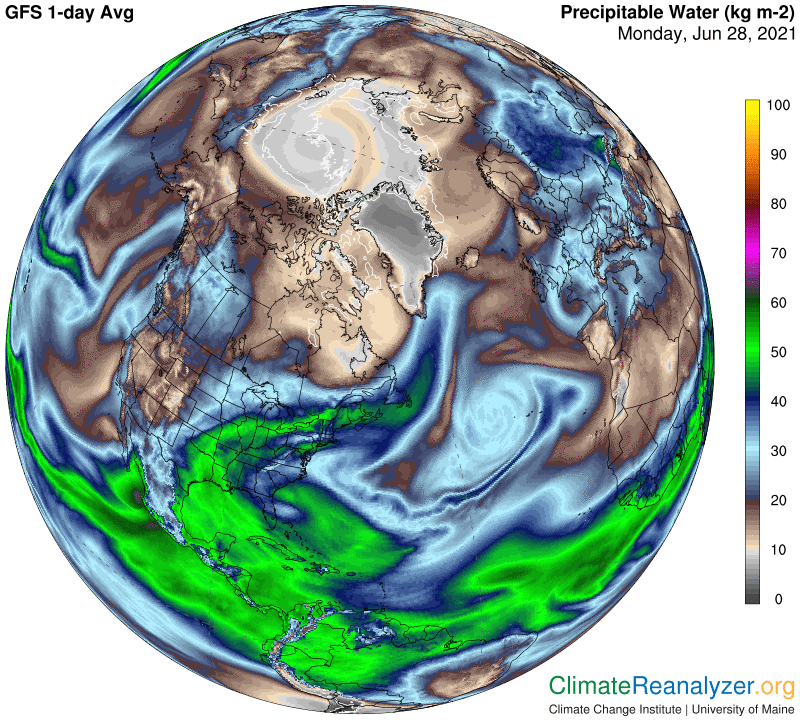
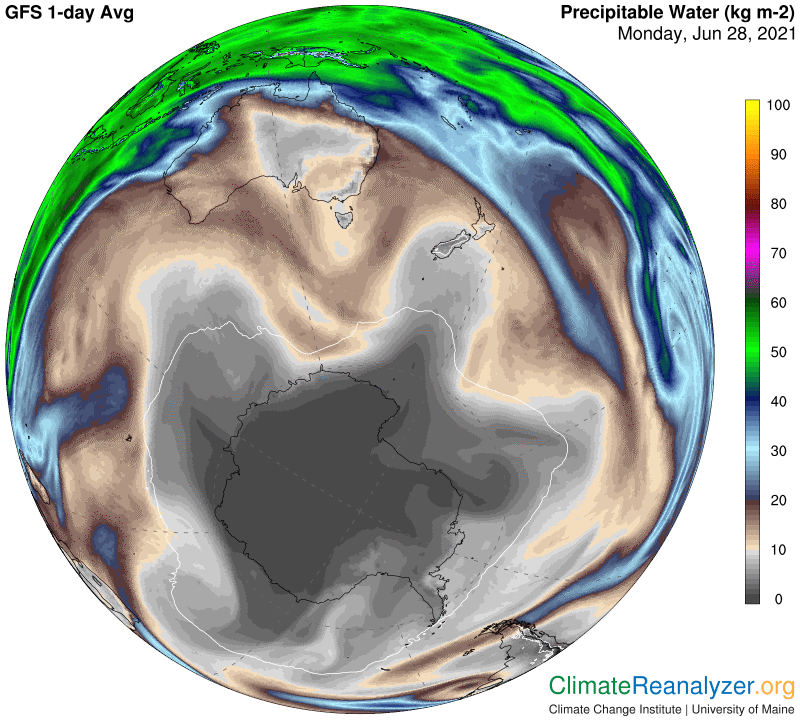
We finally get to take a look at how this mechanism applies to the PW content of the atmosphere. The most important takeaway is that the lowest total concentrations of PW in the atmosphere, as depicted in light gray, tend to be found within the confines of the area identified by the blue zone. The next lowest, in light brown, are basically found within the area of the green zone. Beyond the green zone everything changes, with a wider mix of mostly stronger PW concentrations that seem to be running around all over the place. The implication is that the jetstream winds surrounding the blue zone and the green zone exercise a degree of control over the movement of PW concentrations that exist in the upper atmosphere, somehow holding back the normal tendency for PW to migrate toward the polar zone by doing so:
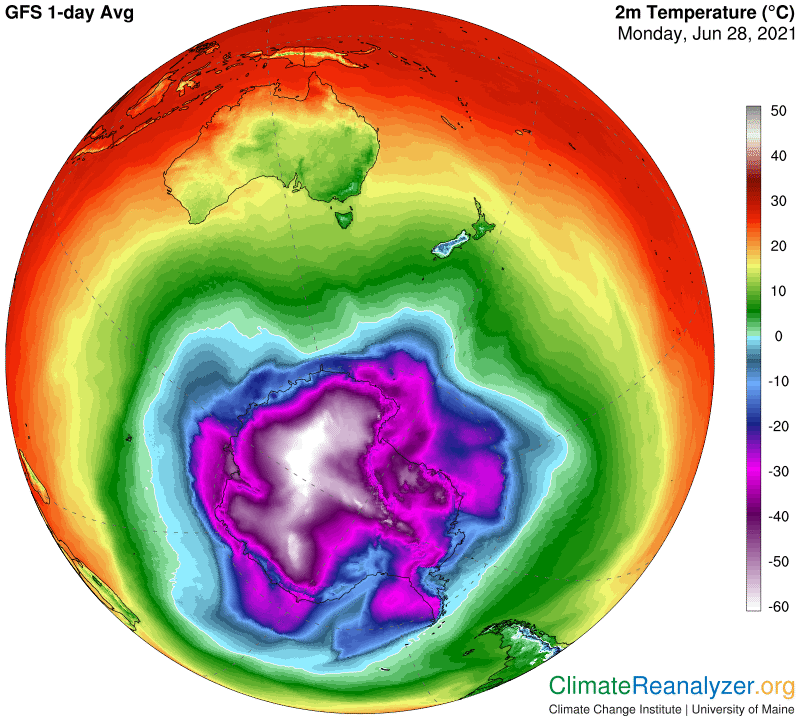
Now it’s time to open the same four images tied to the SH, applying all of the same principles of observation. In this case the widespread frigid surface temperatures in the polar latitudes lead to high-powered jetstream winds that effectively hold back much greater amounts of the high-altitude PW movement that would otherwise be exerting much more greenhouse warming closer to the polar center. As a result, temperatures in the SH are now running about a half degree lower than they were thirty years ago. The north, by comparison, keeps getting closer to being a full degree higher than it was back then. The discrepancy has been widening.
Carl