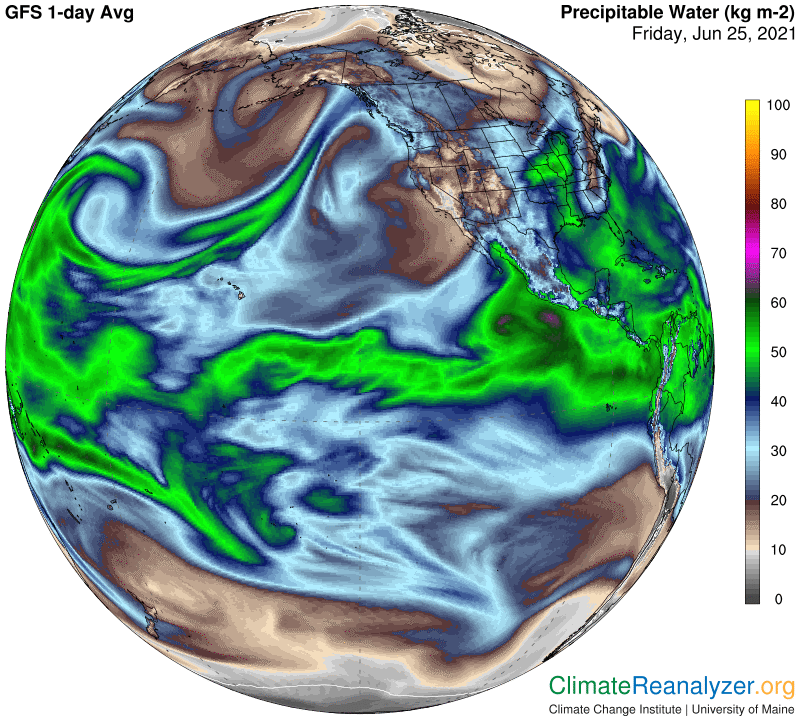
Some historic temperature extremes are expected this weekend along northern parts of the Pacific coastline, so we will want to see how the whole situation looks on the weather maps. Today’s maps are helpful except that much of the information in view comes from averages that include readings made on Thursday. You may want to open the same but newer maps for an update over the weekend—just go to https://climatereanalyzer.org/wx/DailySummary/#pwtr to get started. The precipitable water (PW) map gives us an immediate clue to where the source of energy that can supply so much heat is coming from. This concentrated stream of PW originates in waters all around Hawaii, mostly to its west. Note the way the stream breaks apart upon reaching the coast, with most of the following content heading south toward Washington state:
This shot gives you an idea of how much of the original content was lost by rainfall along the early route. Once the stream has broken up the skies tend to become less cloudy or clear:
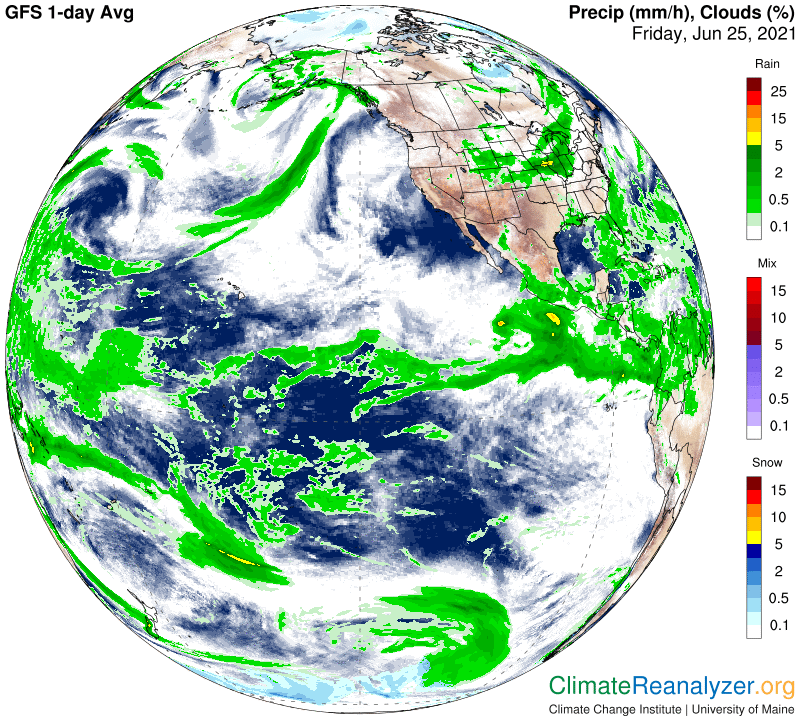
The rainfall started at about the point where the early collection of fresh evaporation connected up with a sturdy jetstream wind. Contact with this wind also helped to narrow the width of the stream, thus raising the level of concentration, and keep it moving swiftly forward:
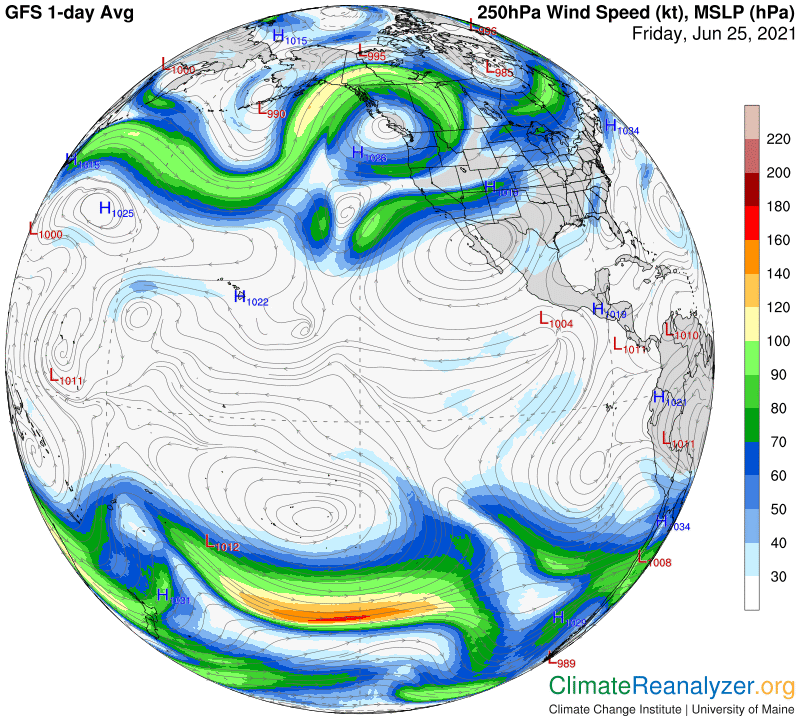
The course taken by the jetstream is governed by regular pathways that are set up by the isobar arrangement associated with the configuration of high-altitude air pressure differentials, which are well-defined by the color shadings on this map. The major pathway on the green-zone perimeter and the one just inside the red-zone both come into play here, at first by close contact and then following their separation as the southward bend unfolds. Most of the PW is ending up on the pathway in the red zone, fashioned into a sharp circular pattern.
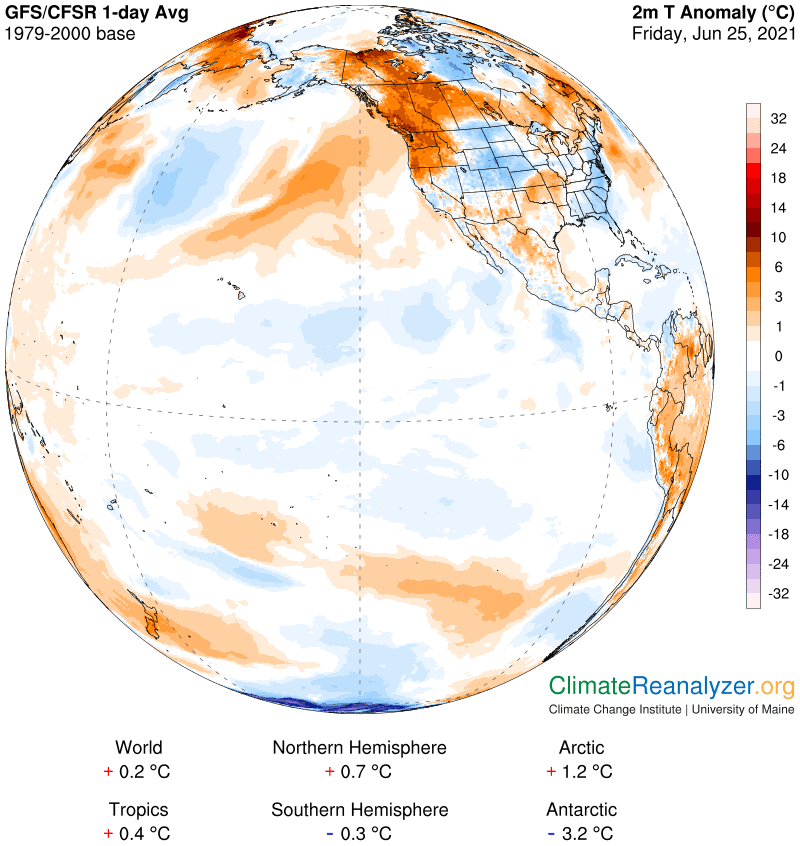
The PW carried off the ocean and finally dumped off by the original stream is of an amount large enough to cause temperature anomalies of 5 to 10C degrees over a large portion of North America. It does so by superimposing extra kilograms of molecular weight of H2O, all of it effective at greenhouse energy production, over the normally modest concentrations found close to the northern land surface. There may be even more of it on the way if the forecasts are right. As noted on the PW map, the highest concentrations of all, over land, have piled up in the Washington state/British Columbia area. That’s how records get broken.
Carl