This letter will be devoted mainly to preserving certain images for archiving purposes. Year-to-year comparisons, if available, can be especially helpful in determining long-term trends. Month-by-month changes can have similar importance for some images. I think of the upper-level air pressure imagery of both types as being the most poorly maintained of all records, and also perhaps the most critical to formation of a sound knowledge base for explaining trends of many types. Here are polar views of the two hemispheres today:
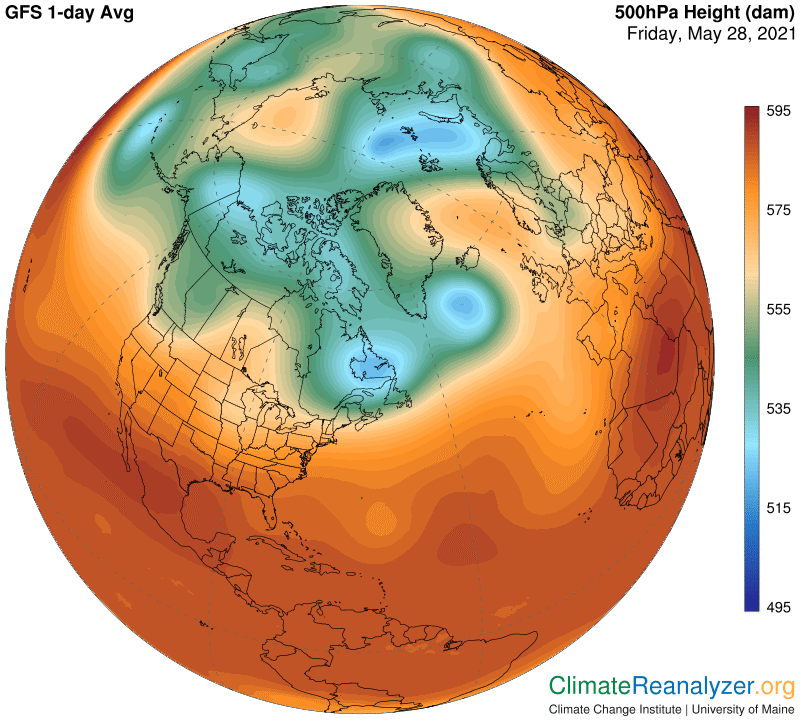
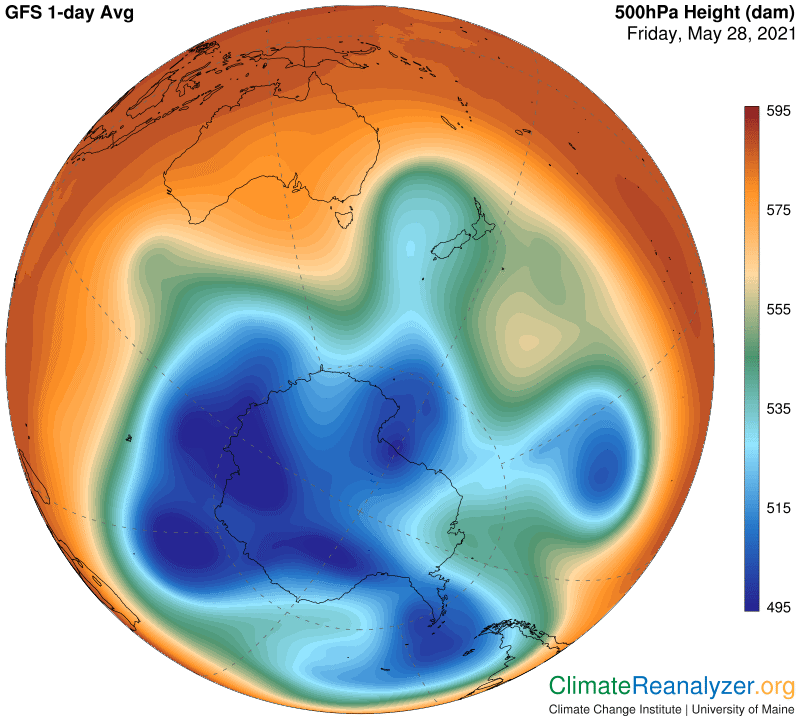
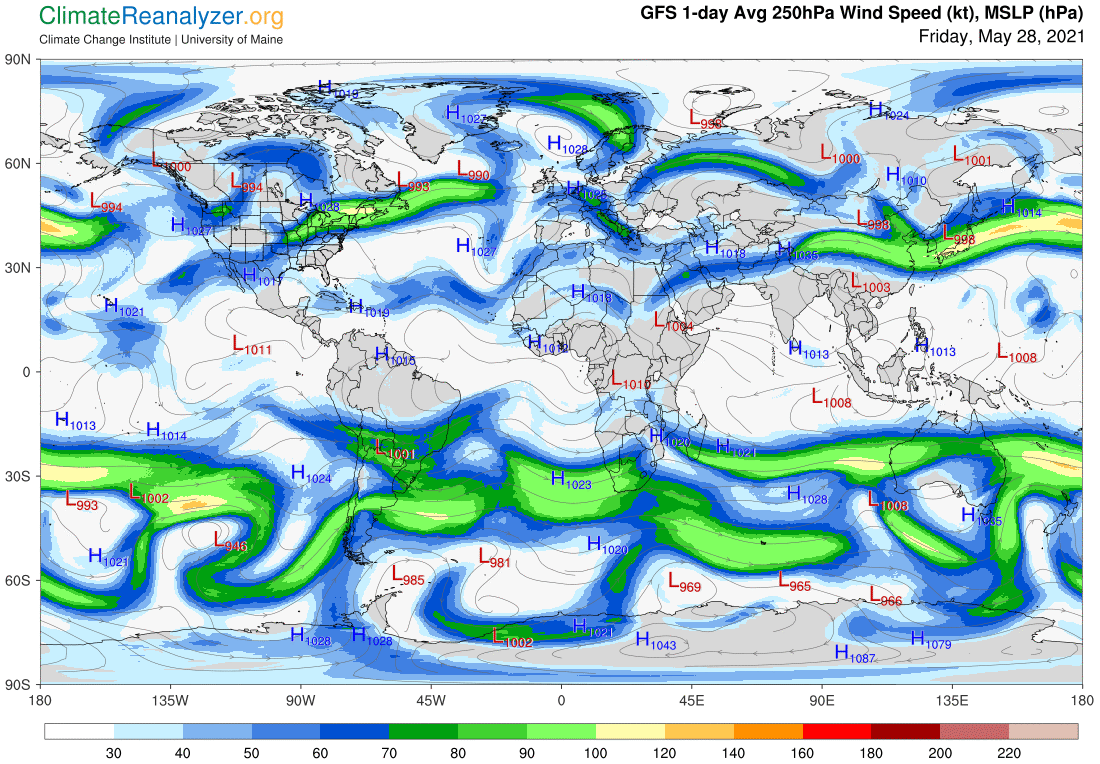
Both of these are in advanced stages of transitioning toward their respective seasonal extremes. The blue and green zones in the north have not decayed as much as I once thought possible. In the south the normally compact shape of the blue zone has decayed by a surprising amount for this time of year, taking the green along for the ride. A global map of jetstream strength and positioning, as next displayed, does not tell us much of anything about any weakness developing as a result in the south, but the anomaly map that follows does reveal an unusual number of places with very warm anomalies over the Antarctic continent. Precipitable water (PW) concentrations as low as a few hundred grams must be responsible, and are somehow slipping past all the barriers that are in place.
The main lesson to draw from this map is that a completely fragmented blue zone leads to a poor quality of jet winds around the associated polar area. The next two months should entail further degradation of these seasonally trending processes. How much so is hard to predict. Warm anomalies from a three-decade-old baseline are sure to continue, but maybe not to the severe extent of last year. Here is where we are now:
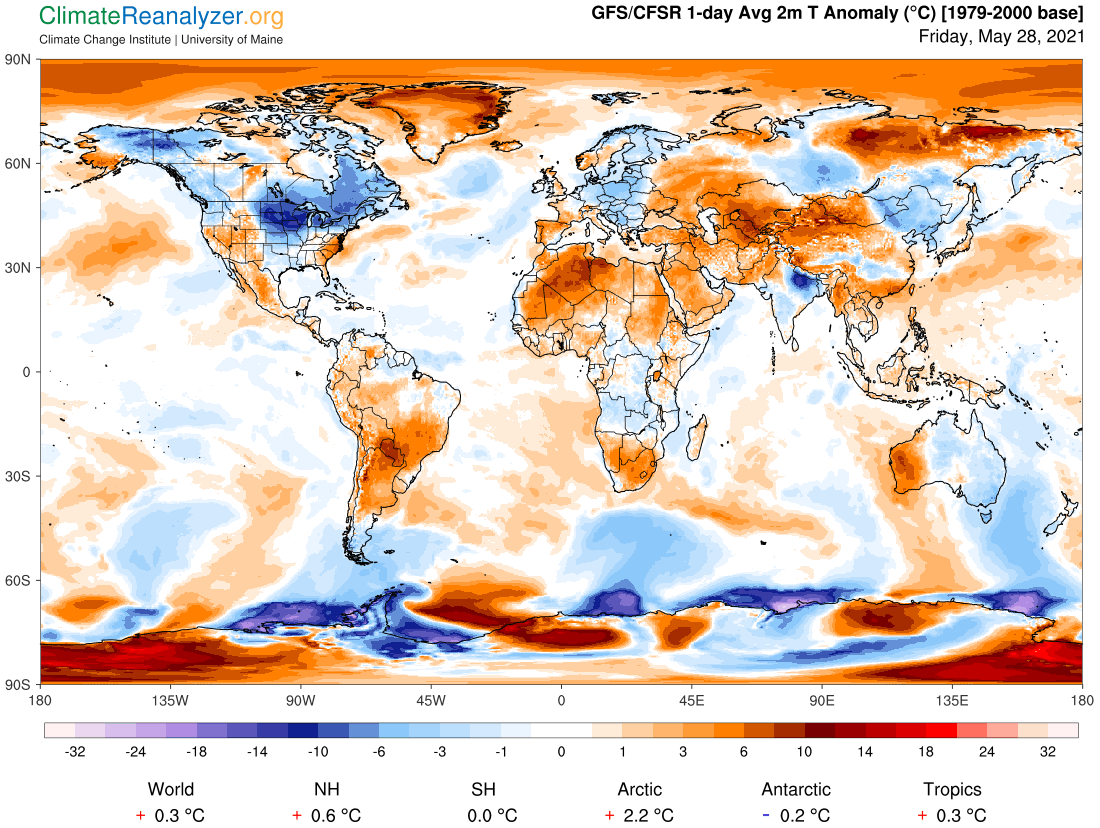
Remember that the Arctic Ocean anomaly is getting some of its warmth as a result of warm currents from the Pacific passing through the Bering Strait and staying below the ice cover, which has itself become warmer without yet thawing. Additional warming due to overhead PW inputs is probably not much different for now. In the south you can see that there is an intense cooling effect from the waters at the continental edges, which is keeping the full Arctic Circle so cool. I think this comes from cold meltwater coming from subsurface ice shelf melting. It shows no signs of going away.
Carl