Is northern Siberia primed for more record-breaking summer heat? It’s still too early to draw conclusions, but there have already been a few really hot days in places, and today is another. We’ll look at it and also at certain conditions that could be setting things up as the main cause. Start with the anomaly map:
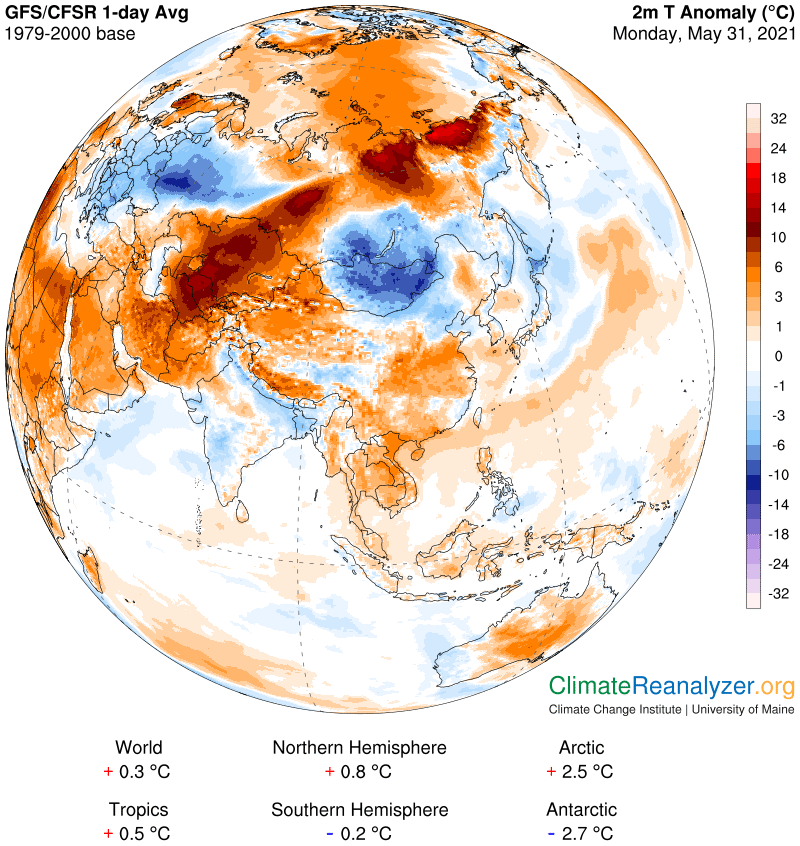
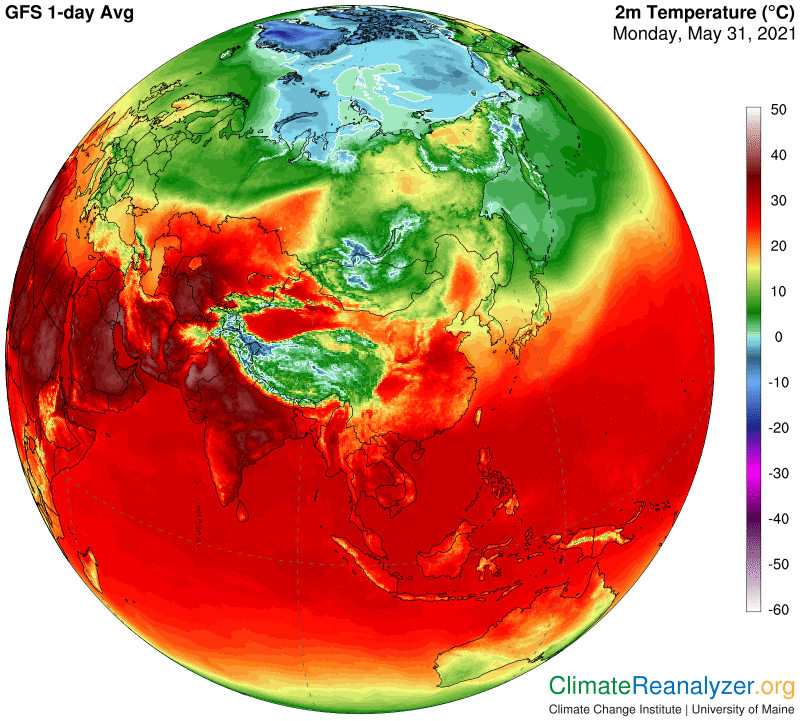
Of the three hottest regions the one at the top has the greatest anomaly, in a small spot showing a range of +18-21C, or call it 37F. The long streak of warming power approaching from the south will be moving into the same area as this spot over the next few days. It serves as a source of greenhouse energy, apparently with nothing in its way, and like all of these things it is in a state of constant motion and largely following the same course we now observe. The next map shows how warm temperatures tend to develop all along that course, and beyond. Actually there are warm anomalies of some degree everywhere, including the one that has lately been acting like a permanent installation over almost the entire Arctic Ocean surface.
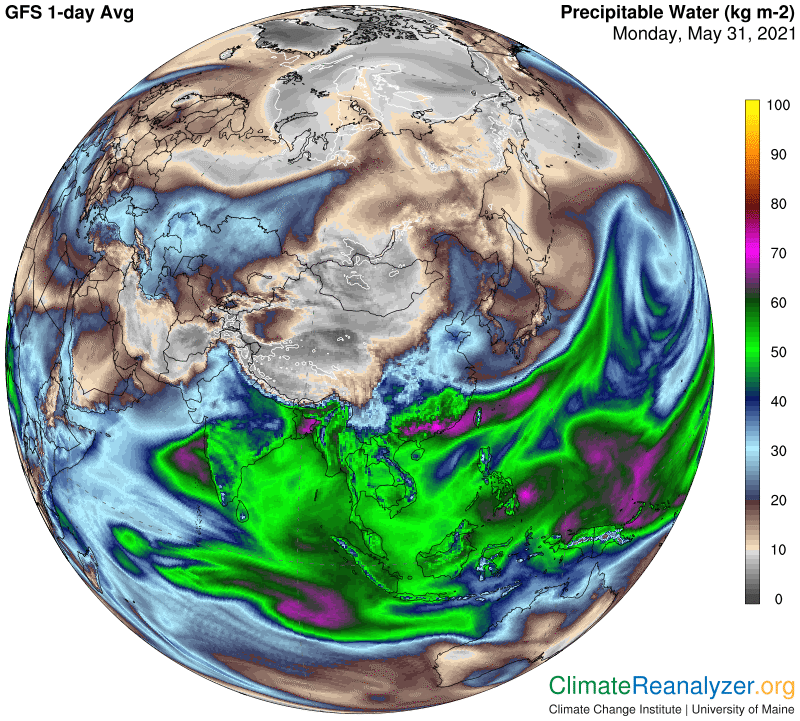
Carl’s Theory tells us to look for high concentrations of of precipitable water (PW) when temperatures are running high enough to produce major warm anomalies, so that leads to the next map. It shows a very broad stream of high PW concentration coming from the southwest joined by slightly lower inputs from another broad stream to the east that is heading straight north. A third large stream still farther east may also be adding particles PW. Streams like these, while constantly decaying in volume, have a way of converging as they approach the polar zone, right where shrinkage of the global circumference keeps intensifying.
Do we know what governs the size and movement of these streams? The widest parts that we see seem to have nothing at all obstructing movement, but then things get more choppy as they progress north. Carl’s Theory tells us to look out for jetstream winds that may or may not be getting in the way. They always have some kind of influence on paths being taken by the PW streams.
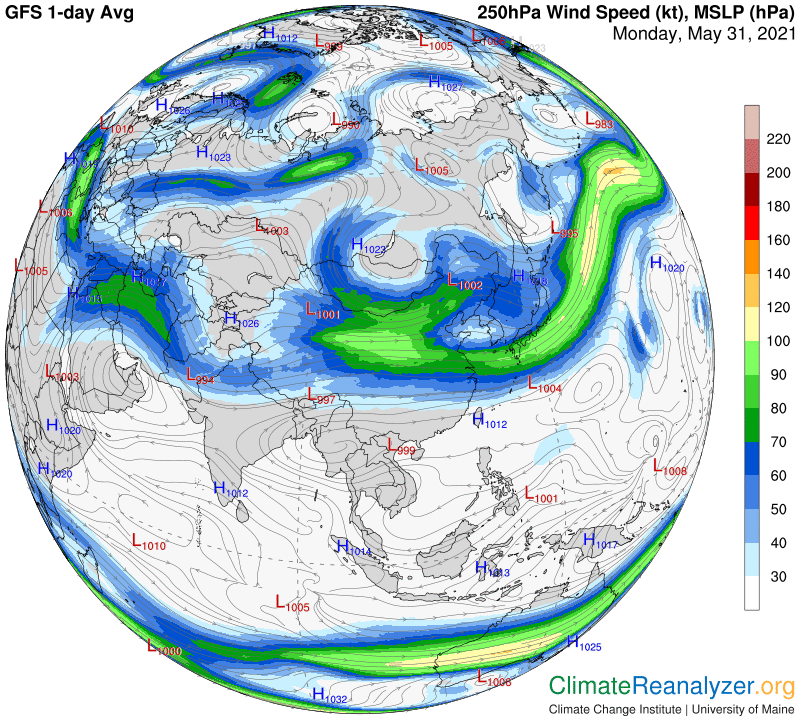
I see lots of open spaces on this map. The only winds that have both strength and lengthy continuation are the ones found far to the south, where they are typically not well-positioned or even strong enough to do much blocking. “Deep-red-zone” winds are known more for being carriers of PW streams rather than blockers. Blocking is generally left up to green-zone and blue-zone wind streams, ones that are visibly disordered in the region at this time. Let’s check on the condition of the air pressure pattern that governs the overall activity of these winds:
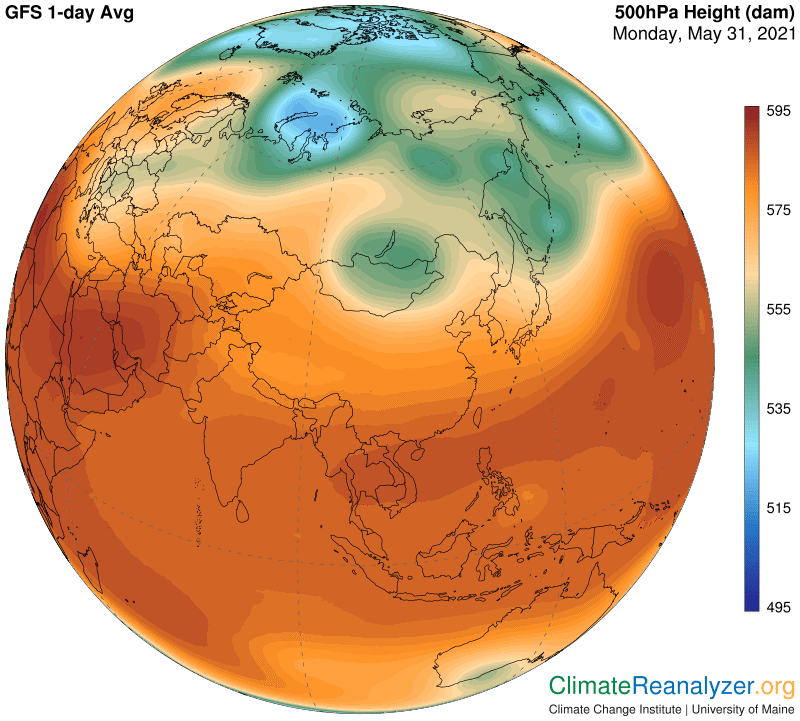
I have no knowledge of what this image, if available, would have looked like 10, 20 or 30 years ago, bu feel reasonably confident that the blue zone has been steadily deteriorating, becoming less compact and more fragmented as it does so. The high-altitude air pressure changes that cause the deterioration are a direct result of rising temperatures in the polar zone. We know for sure how temperatures in this region have been rising for the last several decades. When they rise above freezing the blue zone tends to fall apart. As it falls apart more PW can make its way over the region. More PW means more greenhouse energy is being produced, adding still more to surface temperatures. A positive feedback loop is thus created. We are seeing its impact today, possibly even accelerating with the help of boosts from other regional warming processes that are also occurring. Is this feedback loop perhaps the strongest accelerator of them all?
Carl