The work I have been doing is all based on the finding and interpreting of visual relationships that appear amongst the images that constitute the daily Weather Maps. The maps cover an extended variety of phenomena, some of which we intuitively know will be closely related, others not so much or not at all. What’s exciting about this work is finding relationships that are very close and very consistent, unexpectedly so, perhaps even completely unexpected. These are the ones that most greatly demand an explanation. Other relationships are found that are not quite as close, but still fairly consistent, and most likely not high on the list of expectations. These, in my opinion, are just as much in need of an explanation, simply because there must be something real about them that possibly should not be ignored. Today I want to start reviewing and qualifying some of the relationships I have sought to establish in the past year of letter writing.
One of the strongest of all is the relationship between the total precipitable water (PW) content of the atmosphere and its effect on surface temperatures, with one strict limitation and another that serves by modification. The strict relationship falters when PW reaches a saturation point, which is common all year long for most locations within the tropical belt. Away from the tropics the relationship is modified by whether the surface below is of land or open water. The use of PW as an instigator, attributed to its extraordinary greenhouse powers, is something that is utterly and completely unexpected as far as mainstream science is concerned. The professors simply have nothing at all to say about PW, as commonly defined and measured, having any such capability. By contrast, all I can see on the maps is a thoroughly close and consistent relationship from any number of different perspectives, whether it be up close or on a broad scale. It can even be said that when a change in total PW is reported over a surface location a corresponding logarithmic change in air temperature at that location will be recorded almost immediately, with no waiting period to speak of. That’s what you can call a truly close relationship, and I have not yet found a reason to believe it is not consistent.
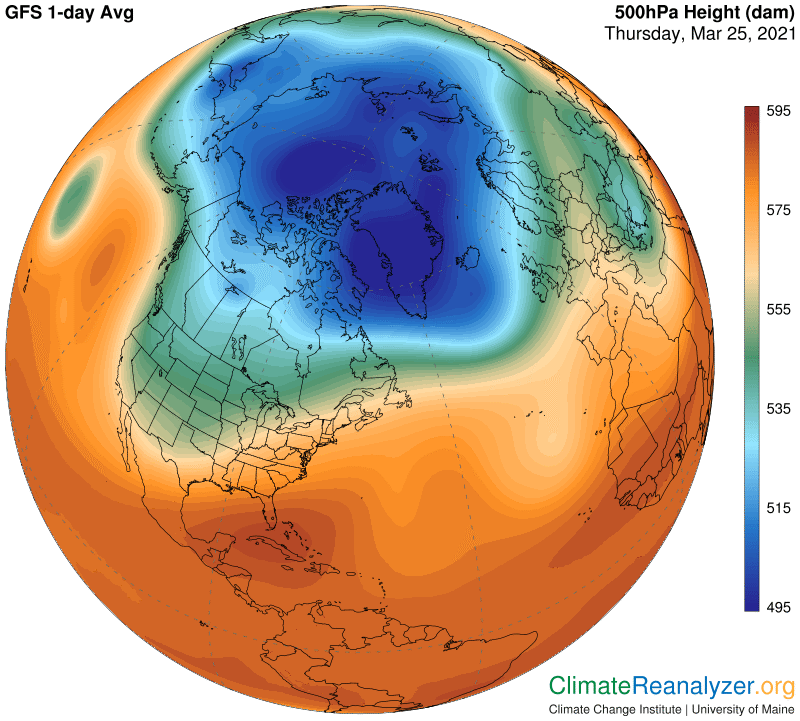
Another extraordinarily close and consistent relationship I have found is the one between the configuration imagery of upper-altitude air pressure (recorded at 500hPa) and the strength and positioning of jetstream winds and their pathways (recorded, quite amazingly, at the much higher level of 250hPa). Air pressure differentials depicted by the imagery must have full governance over this special type of wind organization and behavior, a relationship does not get as much attention as it deserves in the sciences. In particular, there should be more interest taken in whatever factors there may be that cause changes in the construction of the configuration. Changes are always happening, day by day, on some occasions more quickly or extensively than others, and the jets are affected by every change. Whatever causes the configuration to change will quickly proceed to make changes in jetstream activity, and that should always be a matter of interest. I have been looking for answers to the causes of configuration change within the map imagery, and have found some excellent clues, but this is still a work in progress. Associations are present, but they are not quite as close or consistent as the other relationships described above.
What we know for sure about the configuration, which only takes it final shape at an altitude of around three miles, is that surface air temperatures have a powerful effect. There seems to always be some amount of “slippage” in the way the effect is transmitted, including how much time it takes and how far away from strictly vertical the reach of the transmission might extend. Does surface air pressure interfere? Or wind? Surface altitude? Anyway, as long as the big picture is clear, which is practically always, a little slippage in the shape or size of the image, compared with the range of surface temperature imagery, is not important. What matters is what the outcome is like not long after a noticeable change in a fairly large expanse of surface temperatures has occurred.
On today’s map the blue zone shows up as a compact and almost perfect square. There is plenty of below-freezing temperature below the zone, but no image on any map has a shape quite like it. One thing we can predict is that a few weeks from now the blue zone will have an entirely different look, with some amount of fragmentation and much less blueness. And a few weeks later still more of the same. Jetstream winds will react immediately and accordingly, showing far less strength. And the north country will have a lot more PW in place, helping to make it warmer.
Carl