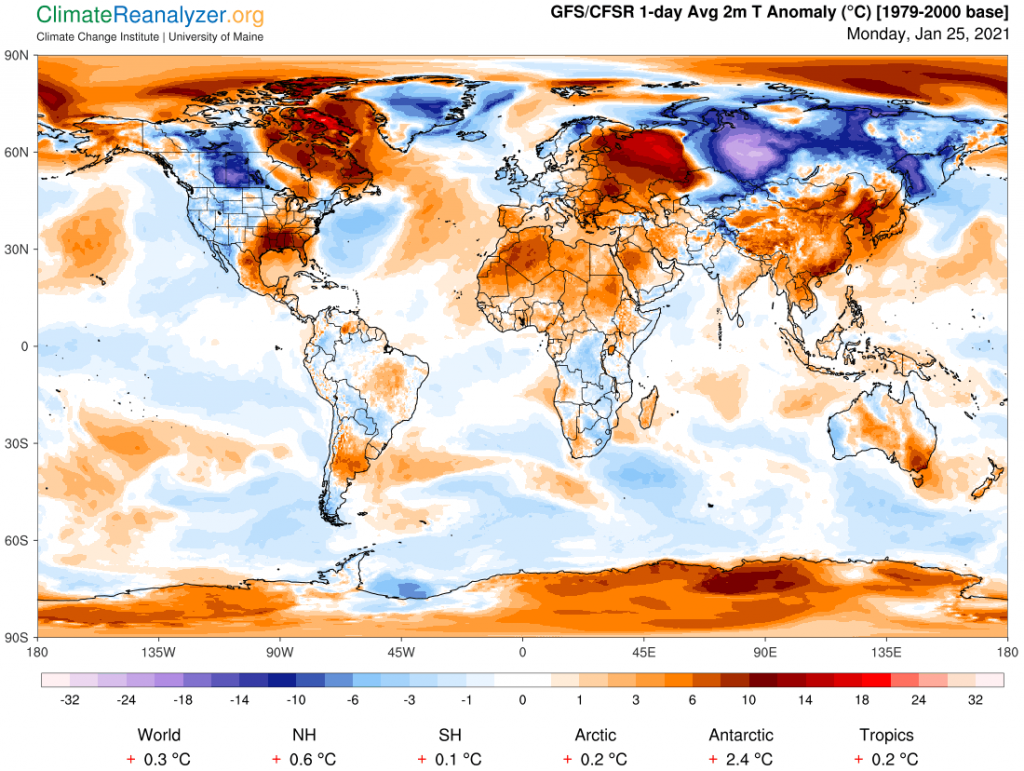
Many things are of interest on today’s full-globe temperature anomaly map. See how cool the SH remains in spite of the vast extent of warming inside the Antarctic circle and of the continent by itself. Water surfaces, for whatever reasons, have an outsized part to play as cooling agents. The NH has an interesting mix of nothing much other than extreme numbers depicting warm and cold anomalies. Why so little in between? With that thought in mind, let’s focus on two of the most contrary anomalies, both within the eastern half of central Russia, with centers probably a little less than 2000 miles apart. They are both on about the same latitude, the warm one slightly more to the north while also a little lower in elevation by about 500 meters. They are easy to locate on the map:
Detailing the differences between these two extremes becomes a fascinating exercise, worth making the effort needed to do the viewing with maximum magnification. I have done so with the next anomaly map using 500%, easily catching both spots on one image, further captured by use of a snipping tool. Here is how it looks:
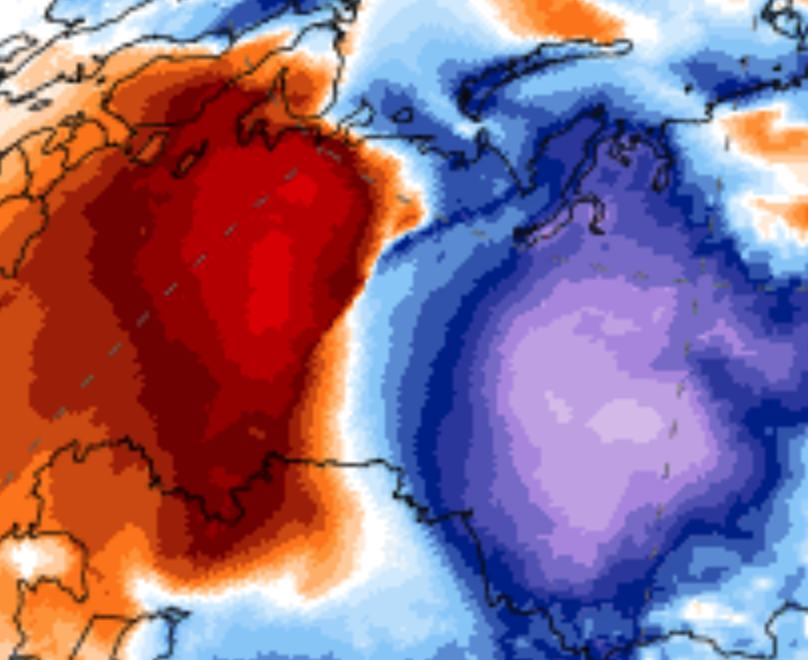
The depth of the cold anomaly, at its coldest extremes, is especially interesting because it is so rare, measuring between -24 and -28C. To check this out, one must count the shading changes away from the deepest blue, which reads -10-12 (scale under the top image), arriving at -24-28 after six shading shifts. The warm anomaly is much easier, requiring only three shifts to go from the +10-12 dark marker to the max reading of +16-18. This is not as extreme as the cold one but the total difference of 40 degrees is unusual at such close quarters. Things will get even more interesting and unusual when we look at actual average temperature readings for the day between these two locations, viewed here in the same way:
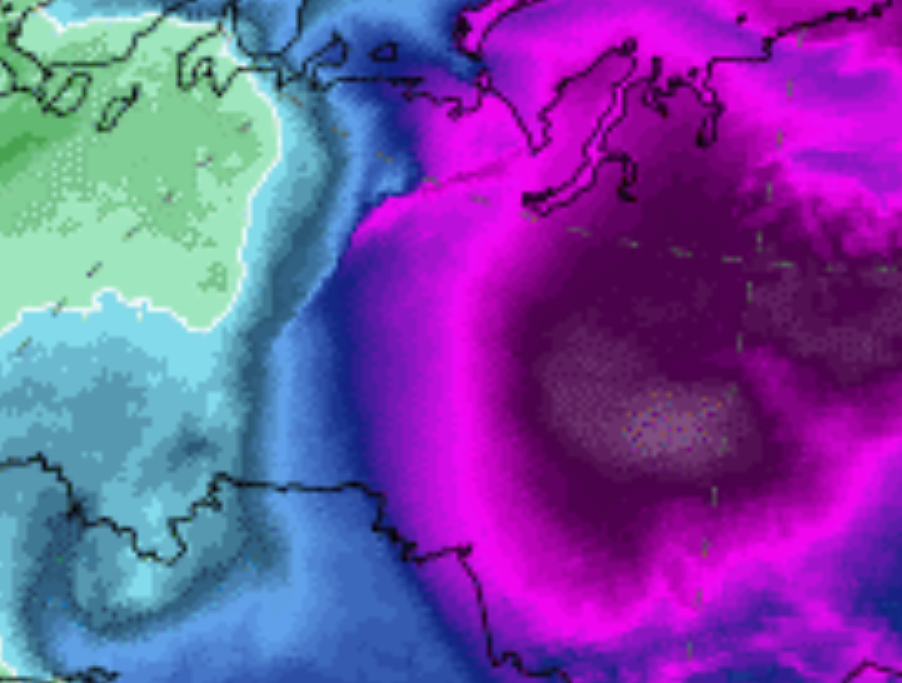
This time you will need to go to the Weather Maps site to get the shading scale, then take some pains to get a good closeup reading on the cold one. I see about -58C for cold, +2 for warm, for an amazing difference of some 60C or 108 F. The more eastern part of central Russia may normally be quite a bit colder in winter than the other, but how could the actual difference ever be as great as this on the same day for locations having so many things that are either in common or nearly so? For a possible clue we can go to the precipitable water (PW) map, remembering that daily sources for local PW inputs are in large part completely randomized by nature:
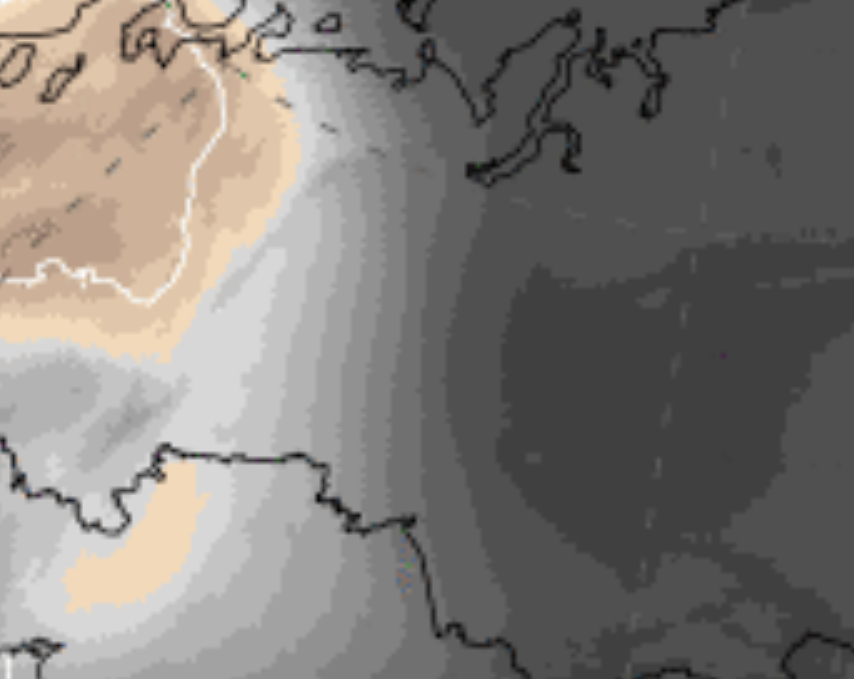
This image makes it very easy to count shading shifts, starting from 0-1kg in the blackest part out to 9-10 in light gray, followed by the brownish section starting at 10-11kg. Two shifts from there brings the warm anomaly up to 12-13, a number that looks acceptable, but what should we do about the cold place that remains stuck well inside the very large and uniform 0-1kg zone? There is no visible way to break it down into grams, but we do expect that there is such data on file somewhere, and we can in fact find reports from Antarctica that recorded gram numbers down in the teens when temperatures were hitting lows of around -80C. I’m ready to guess that the spot we are looking at today would realistically be about 200 grams, based on applying the same rule and thought processes that were fully described in Friday’s letter.
What I can do today that I couldn’t do on Friday is to simply run the 10-degree-per-double rule for PW numbers all the way out to a relatively nearby location that is 60 degrees warmer on the very same day. Maybe I cheated a little in making my 200-gram estimate for the cold spot, but let’s suppose that it will be proven to hold up anyway. Then all we have to is to double 200 grams six times and see what we get. The result: 200-400-800-1.6-3.2-6.4-and finally 12.8. That’s 12.8 kilograms. It may all sound suspiciously contrived, and I’m not ready to guarantee anything, but why is this general hypothesis not worth testing with a more advanced set of tools? I believe scientists have access to all the tools required, plus whatever time is necessary for a brief initial run of tests, if motivated. I can’t make it happen, but can still keep writing up observations while hoping someone else with better contacts eventually gets caught by the same sense of curiosity.
Carl