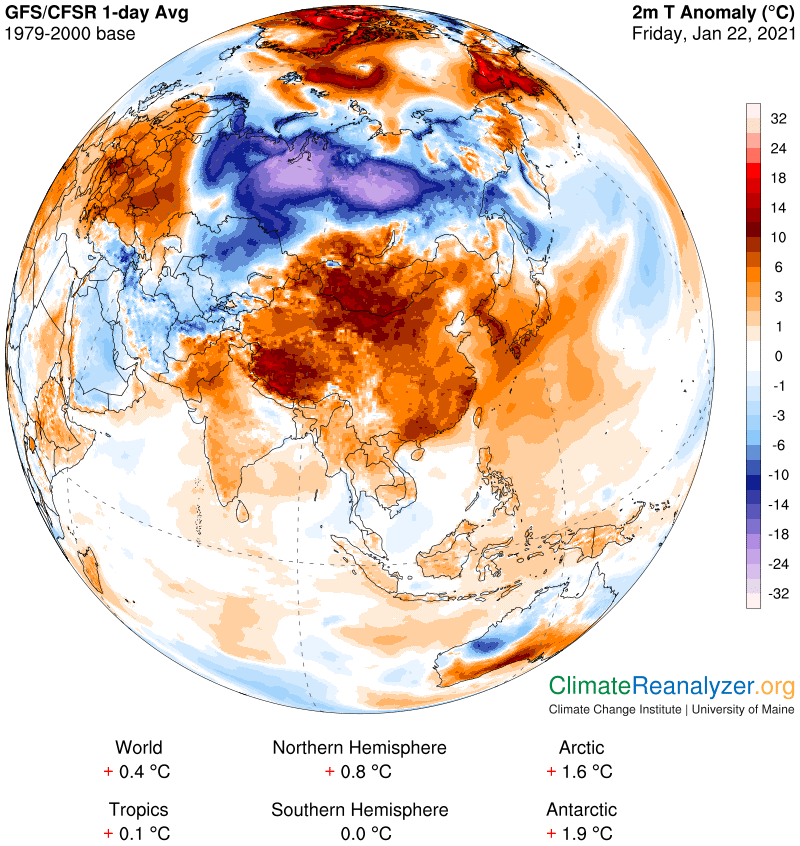
Anatomy of a bitterly cold temperature anomaly. This is happening in Siberia, with the worst parts of it mostly a bit south of the Arctic Circle and most likely in territory that is populated. To assess the anomaly correctly one will need to magnify the map up to 200% or more, then count shading changes away from the darkest blue. I have come up with a rarely-surpassed reading of 21-24C below normal (about 40F) in the two adjoining areas of considerably large size shaded in light violet:
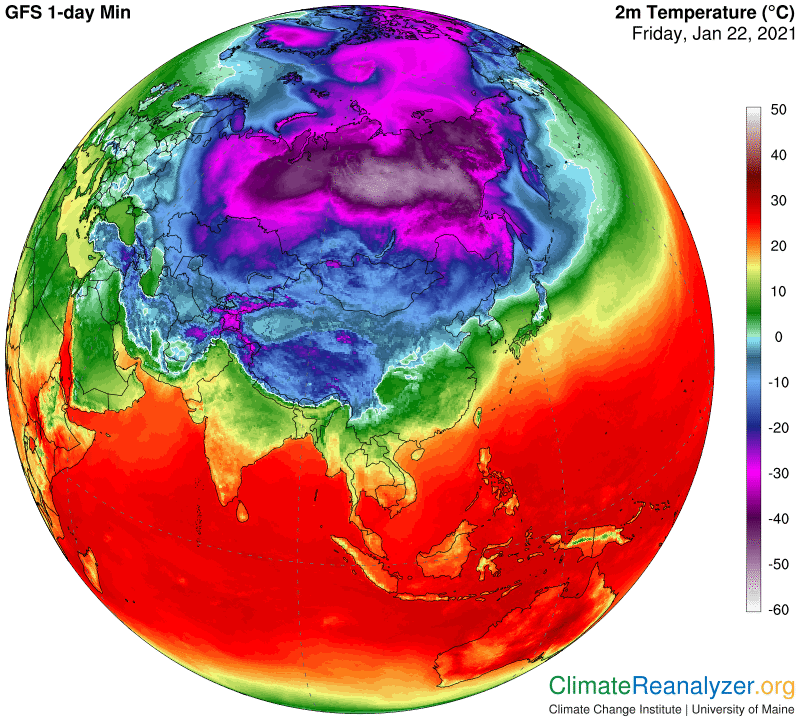
As for real temperatures, the area to the right is the most interesting because its minimum readings, as shown on this next map, almost go off the chart. I’m seeing about -58C, equal to -72F. On a larger scale, observe the overall size of the continental area enclosed by an outer border having magenta shading, implying that all temperatures are at of below -30C. This area includes nearly all of the massive Russian nation, and nearly all of it is many degrees below normal for the day:
The underlying cause of every temperature anomaly, large or small, can be explained in some way. An anomaly of this extraordinary size and degree of abnormality should require an extraordinary explanation. The one you will get from me, which no doubt differs from any of those you may get in the news, is centered upon the total amount of precipitable water (PW) in the corresponding atmosphere relative to its usual value for the day. This map holds the key:
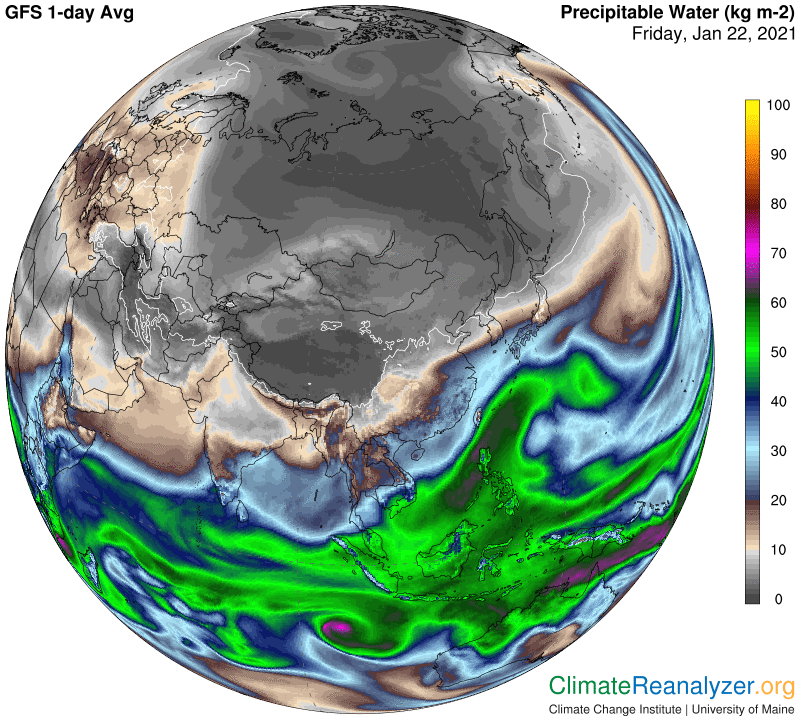
The best way to zero in on this association begins with getting an up-close look at all the gray PW shadings to see where the darkest of them are, in terms of size and shape. In this case the darkest of all is quite large in size, and has a shape that fits squarely over the very coldest region on the temperature map, one that is well inside the magenta borders and contains readings of -40C or less. We don’t really know what the exact PW readings are within the uniform dark shading of this region except that they must all be less than 1kg. I’d love to know exactly how much less in those particular locations where temperatures have approached -60. My guess is it would be something less than 200 grams, obtained by following the implications of my rule that every doubling of PW value (outside of the tropical belt) will raise surface temperatures by about 10C. If anyone has an exact PW reading to share, taken from anywhere within the under-1kg area at that time, it would surely be appreciated.
PW readings, regularly taken, will result in average values if they are assembled in the same routine way as temperature readings. Daily anomalies can then be easily reported for study purposes, allowing PW anomalies and temperature anomalies to be compared in all parts of the globe. Some day I think this will happen, and many things of value will be learned from doing so. For example, it may help any effort to understand why it is so common for both temperatures and PW values to drop sharply whenever air pressures in the skies high overhead are pulled into a configuration like this one:
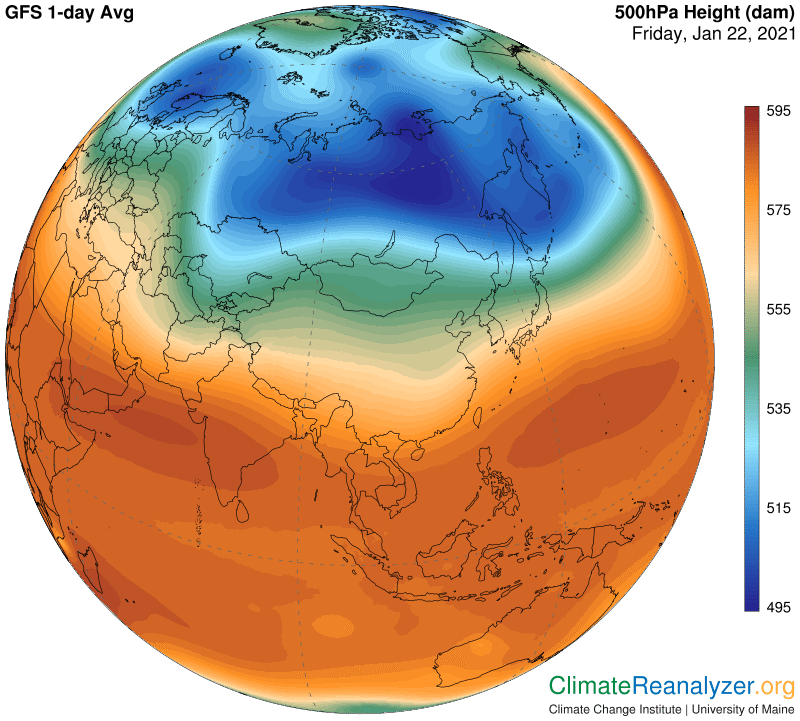
Could there be physical connection between regional total PW values and the arrangement taken by air pressures at corresponding high altitudes? I have offered an affirmative answer to that question, and explained it many times in these letters, accompanied by illustrations. Without getting into details, I believe the connection holds true today, in an event that reaches deeply into the realm of physical limitations for cold anomalies in the world that we know.
Carl