There is some interesting activity available today on the Weather Maps that I think is worthy of attention. It involves the amazingly close connection between jetstream wind pathways and the high-altitude air pressure configuration (HAPC) that nature has put in place for the day. What makes it so interesting is the way the wind pathways are tracking around the weird, amoeba-like shape of the HAPC, now going through a regular series of daily shifts. As is often the case, there is something new to be learned here, this time about the possibility for a pathway to form unexpectedly. I’m seeing for the first time a fourth complete major pathway, one whose winds would normally be quiet, but not today for some reason. That’s just an unanticipated part of today’s story.
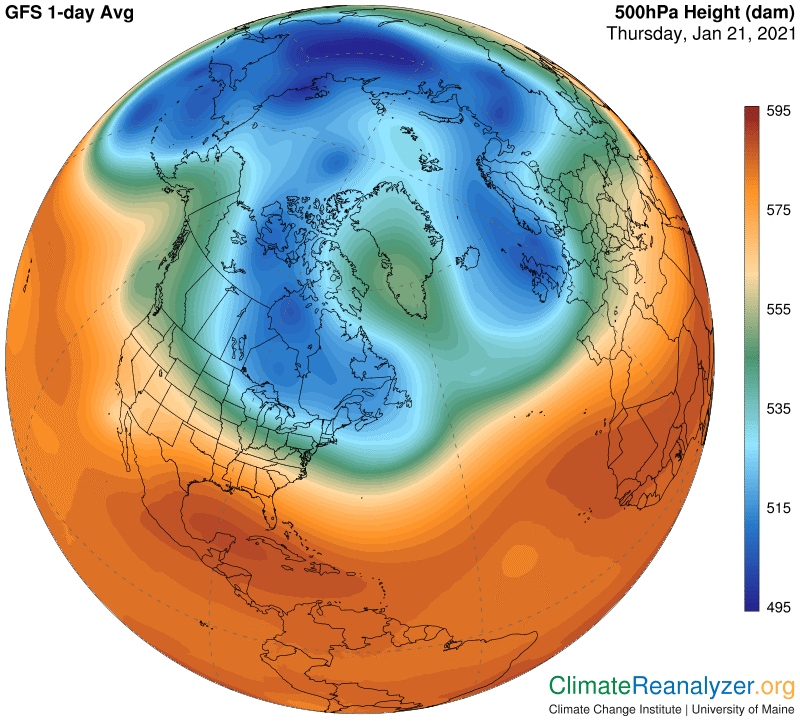
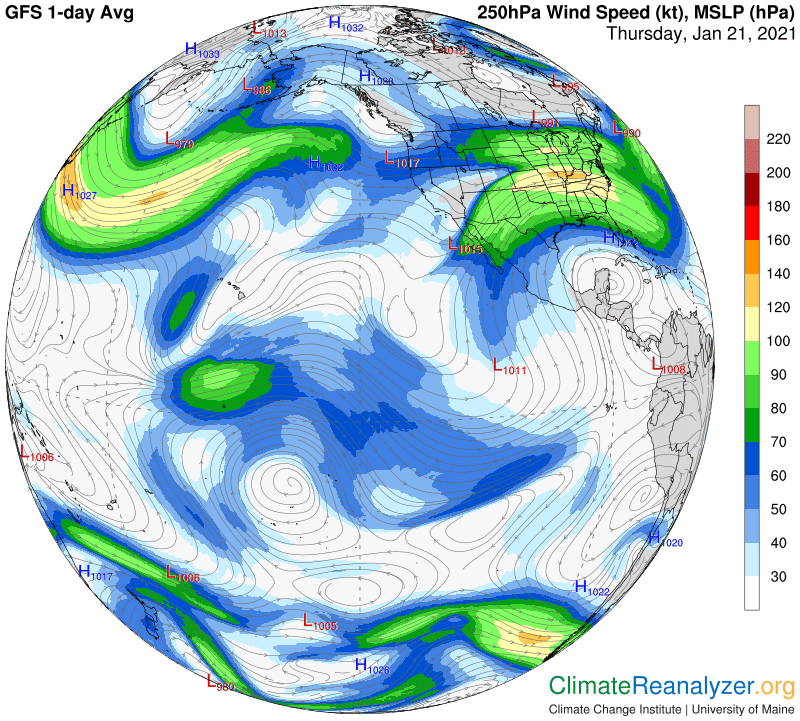
There is a point to be made about these two next images that you may not be aware of. The data for the HAPC map is always collected at an altitude within a range of three to four miles up, where pressures of 500hPa (or half of surface pressures averaging 1000hPa/millibars) are located. Surface air pressures, by comparison, are configured in a considerably different way, as you can see at any time on a different map. The actual transition that takes place from one pressure pattern to the other must occur below the 500 level, but probably not far below—I’m still not sure exactly where. The main point here is that the data for the jet wind map is always collected at an altitude of 250hPa, which represents one-quarter of surface pressure, found at a level about three miles higher than 500. When you see how well these images correspond you realize that the configuration created at 500hPa must remain essentially unchanged all the way up to 250 and probably higher. Is there an implication that the same jetstream wind activity recorded at 250 is repeated with the same intensities at the 500 level, and everywhere in between? I don’t know for sure, but it seems like a good possibility because of the general uniformity in the connection between jetstream winds and precipitable water movement in the places where they meet. Leaving that subject off the table for now, let’s open the two maps intended for today’s focus:
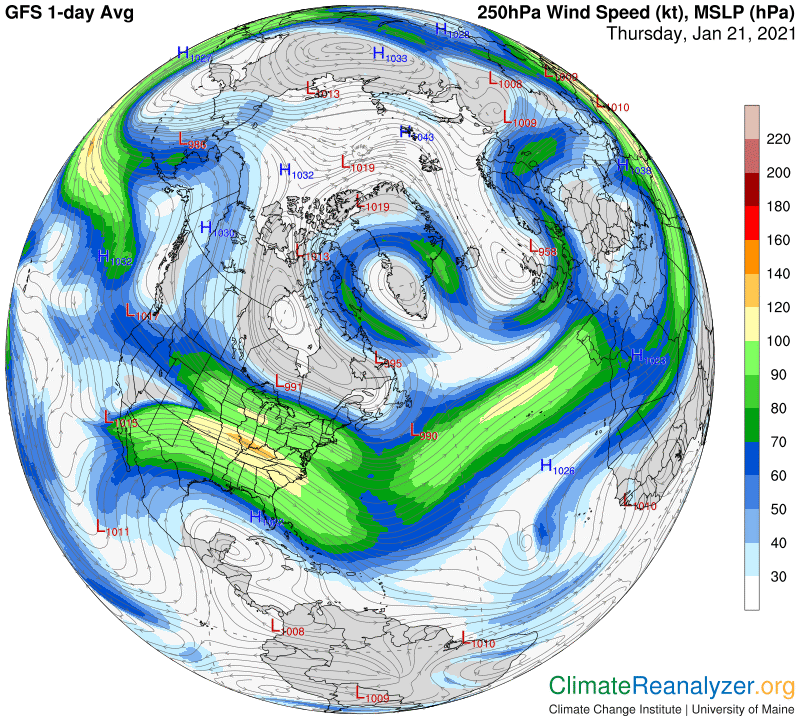
It’s best to compare these images on a live Weather Map screen, where toggling back and forth from one to the other is easy, but this will work. First, look for the regular jet wind pathway that is traced by following the light blue edge of the deep blue zone. The entire path is continuously visible except for a couple of very short breaks where sharp turns are made. This is the innermost major pathway. Moving out, the next one will follow the outer edge of the green zone. It’s all there to be seen, but note that when the air pressure on the edge of the green zone is sharply defined the wind speed on the path is strong, and when the air pressure is diffused the wind speed weakens. The third major pathway is tracked just inside the red zone, about where the original light red shading gives way to darker red. This pathway is also subject to a large amount of air pressure diffusion that causes variations in wind strength.
Now for the unexpected discovery: Moving even deeper into the red zone, where the shadings get still darker, there are clear signs today of a fourth major pathway that may extend over a considerable distance. It begins on this map with a clean start just to the west of southern Mexico, first seen as it curls northward, quickly turns east, and then becomes the outer edge of a strong jet wind when its path becomes conjoined to that of the main red zone pathway. A similar pathway, also appearing from out of nowhere and for no apparent reason, can next be spotted well to the east, off the west coast of Africa, where its clean start is plainly visible on the map. I need to open a different image in order to get a better view of the wind it generates, which can be seen sweeping across the center of northern Africa and continuing over northern India:
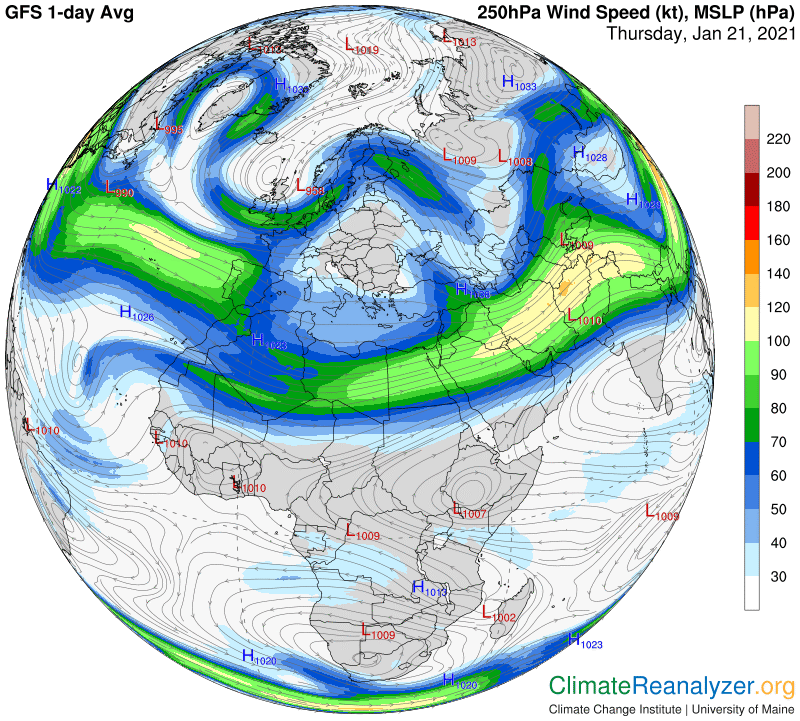
Now I can’t stop. Where does that dark blue streak go when it leaves India?
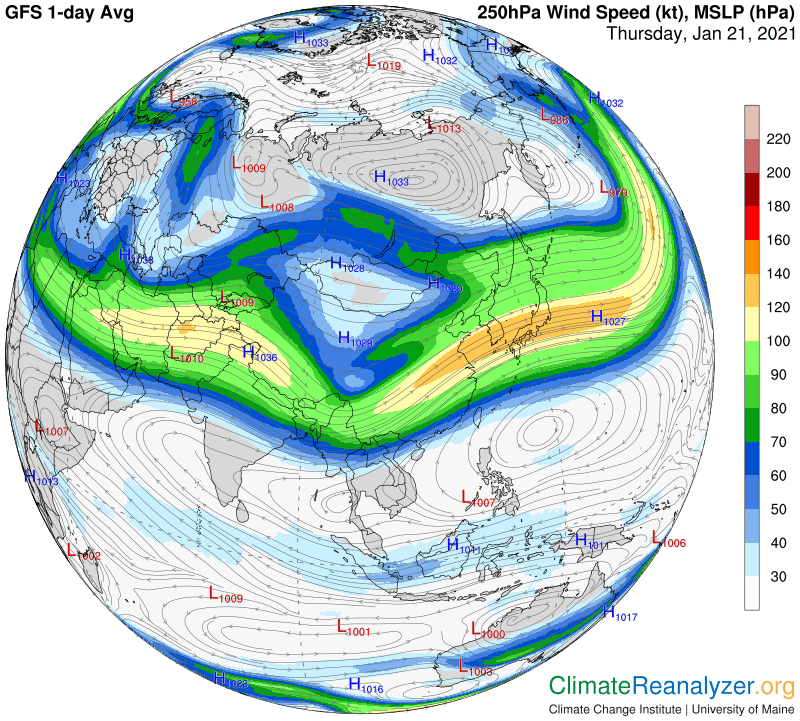
Answer, way out into the Pacific. And then what? By following isobar tracks, I can see a part of this pathway splitting off from the rest of it out in the middle of the Pacific, dipping south, where it participates at the heart of wild and disorganized activity over the equator, then twisting back to the north where it loses speed but soon gets a fresh start as it approaches southern Mexico, exactly where we saw the pathway’s point of origin! We now have a genuine fourth major globe-circling pathway to keep in mind, whenever it should choose to reappear in a mode of uncommon strength.
Carl