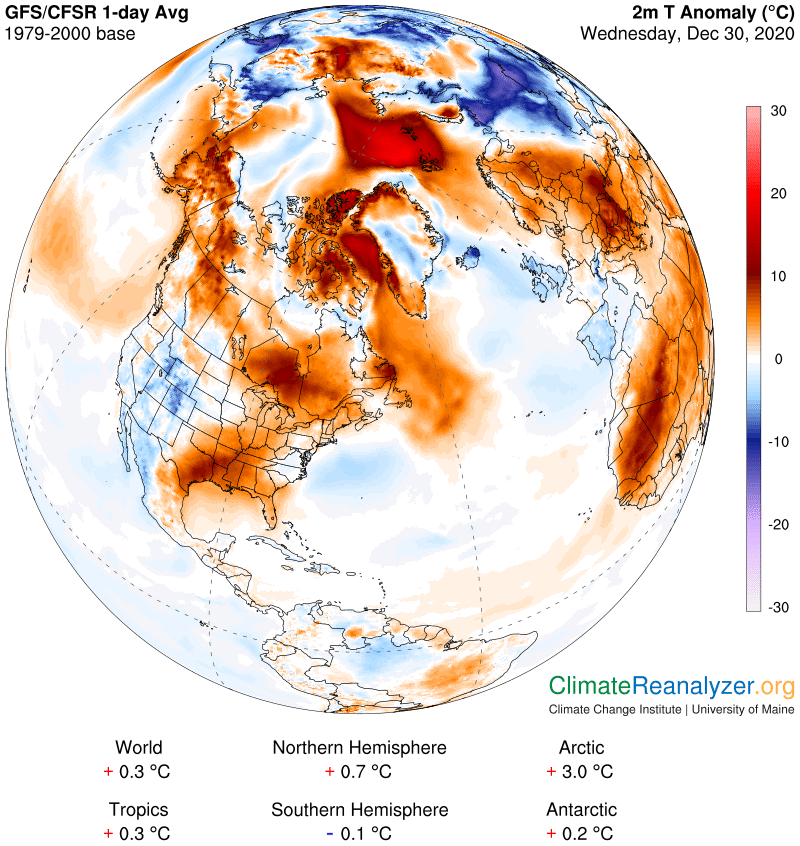
There are several points of interest I want to focus on today, mainly related to things that cause differences in daily temperatures in the Arctic region. We’ll start by opening the air temperature anomaly map, where you can immediately see a lot going on that is making things much warmer than usual. There are also plenty of sharp differences to consider in temperatures having close proximity, and we want to know, how come? Why do we have these specific differences? Be prepared to do some magnifying, as high as 200%, to get the clearest answers.
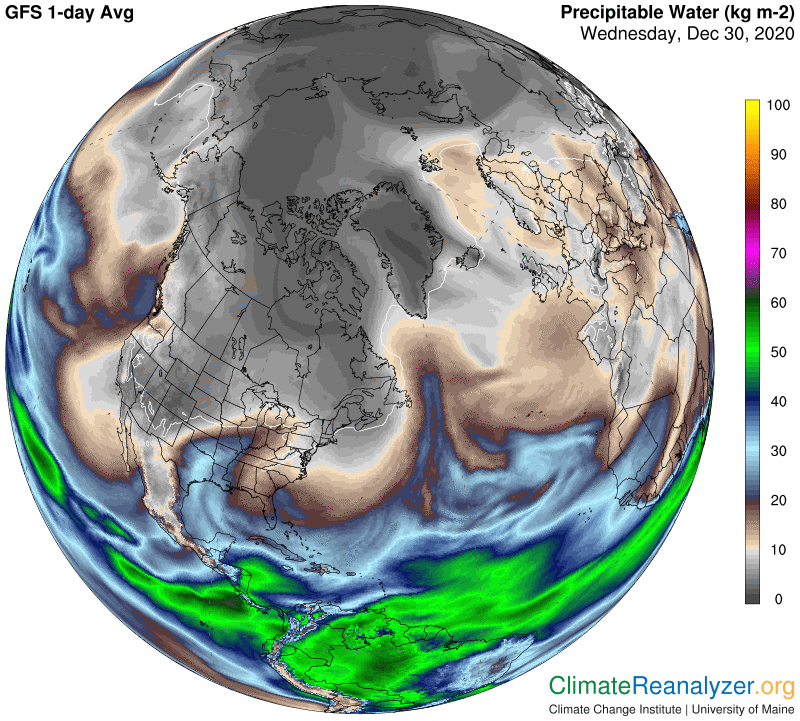
The Precipitable Water (PW) map comes next, because it is (practically) always involved whenever there is a significantly large single-day anomaly, either warm or cold. Look at what it’s doing in the US deep south right now. Much the same thing is happening across the center of Africa, except that it is unaccompanied by heavy clouds and rain. Greenhouse energy effects, while capable of being offset, appear to sustain a certain amount of independence. Or, from another perspective, PW concentrations, no matter how variable their composition may be, appear to exhibit considerable consistency in their level of ability to affect temperatures. From here on I will only talk about the Arctic, where today’s outstanding feature is the invasion of a massive concentration of PW over the ocean from an entry point in the Svalbard area. Another major stream is trying to squeeze in via a Baffin Bay route around Greenland, having a lesser but still substantial impact.
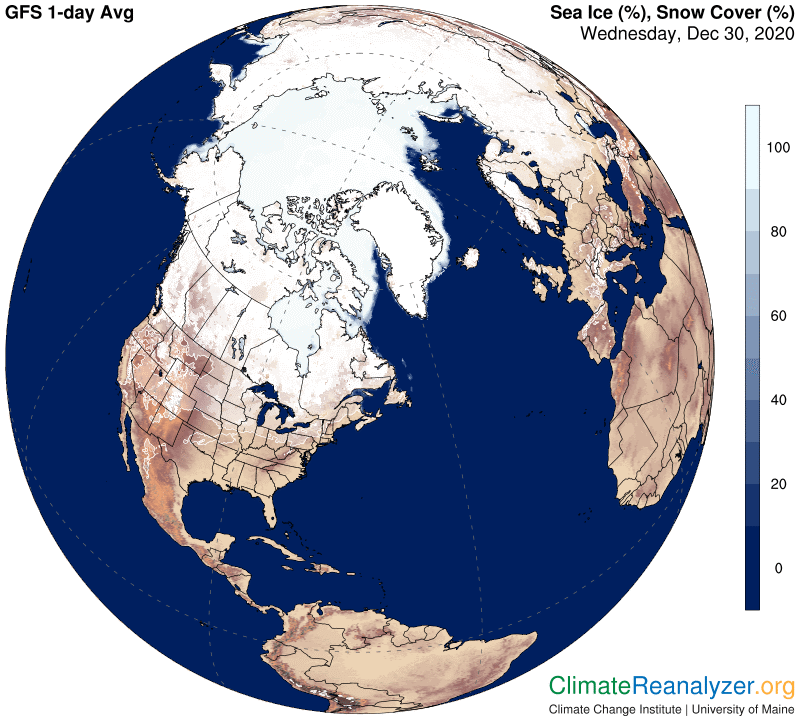
Both of these concentrations encounter open patches of normally frozen-over sea water as they move northward, patches which already must be adding something to local air temperatures. A good question is simply, how much? We want to know the answer so we can subtract it out when doing calculations for the PW affect on temperatures. This next map will help you pinpoint the open water locations most likely to be involved in each case:
The best answer I can come up with, in both instances, is right around 4 to 5 degrees C. I start by looking for specific differentials on the anomaly map, which is helpful but not quite enough. More accuracy can be obtained by going straight to the air temperature map and comparing actual numbers that have been recorded and color-coded:
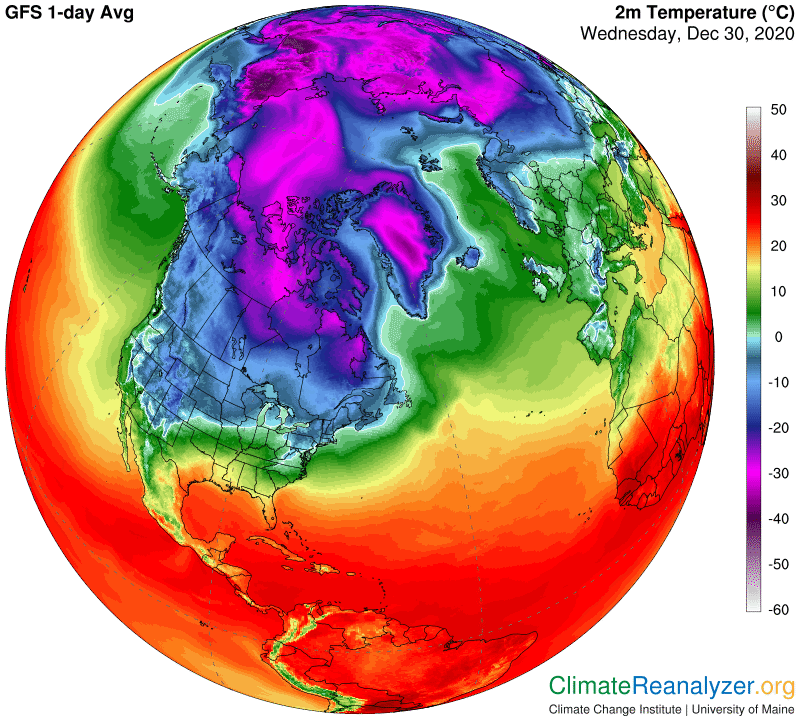
I encourage you to make your own search, using plenty of magnification, and being careful about interpreting the various distinctions employed in color coding, which I think could be improved upon by the chart makers. The outcome of 4-5C for open water effects seems reasonable, and is certainly a significant number which must be taken into account. I can find no sign at all that a still higher number might be appropriate.
There is one more point I want to cover today, related to my basic thesis that every time the total PW content of the atmosphere is doubled, at any location outside of Earth’s tropical belt, and from no matter what level, the effect on surface air temperatures for that locality is likely to be a warming addition of about 10 degrees C. There is a unique way to test this idea available in the above maps by making use of 2kg PW readings, as commonly coded and mapped, as a point of reference. These reported readings literally represent all of the true instrumental readings between 1 and 2 kg, a range having a size indicating that a full doubling of temperatures should be in play between the lowest possible outcome and the highest. Today there is real evidence available to test this idea. On the PW map you will see a very large area of 2kg (or less) shading covering the entire western half of the Arctic Ocean. The area contains no differences at all in elevation, sea ice or solar energy, and practically none in latitude; however, there could easily be a variety of differences in PW between 1 and 2, which we have no way of knowing. We do know there are considerable temperature differences within this area, as obtained from the temperature map. I can see numbers ranging from -32C in one small spot to around -22C in other spots—just right for the 10-degree rule! The anomaly map can also be referred to and reveals the same kind of spread in differences, all within the space of a single, very low, kilogram of PW.
Carl