Today I will discuss the “big picture” of what is going on with our planet’s climate, using full global images for illustration. (These should be preserved anyway for later comparison because of the great amount of disorder currently affecting the NH.) Never forget that everything you see on these images constricts to a point at each pole. We’ll start with the overall pattern of real temperatures for this year-end day, which are near to reaching seasonal peaks:
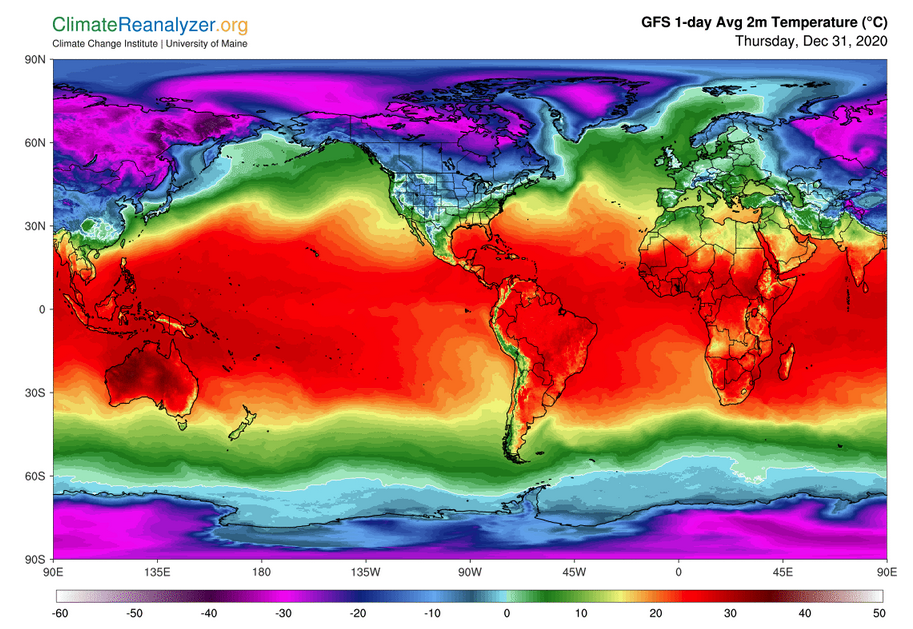
Averages within the tropical belt are about the same as always, except that the entire belt has moved southward by about five degrees of latitude since last July. Beyond the tropical belt the south is clearly the warmer hemisphere, with one major exception—the deepest part of the Antarctic polar zone is much colder than its northern counterpart. Is that all due to the elevation difference, or could it be anomalous?
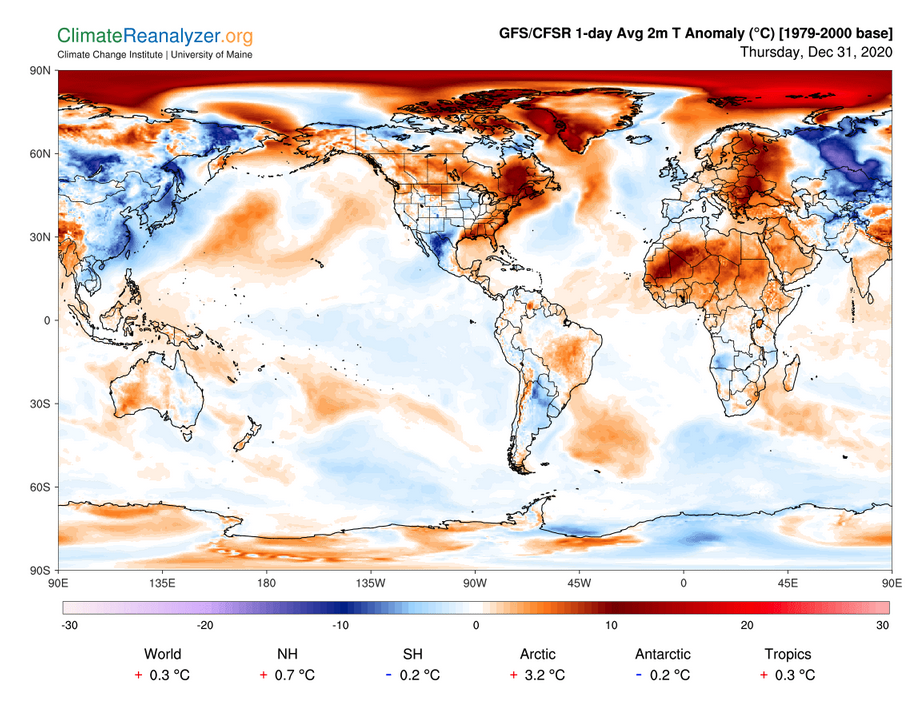
The entire SH, including the polar zone, shows nothing but minor anomalies compared with averages of this same day about 30 years ago. The north is completely different, especially in the highly warmed part of the polar zone. Moreover, why are there so many major anomalies on display, both warm and cold, everywhere you look? The basic fundamentals of climate change favor a regular trend of extra warming in the north right now, as compared with the south, but how does that explain so many large daily anomalies? I think the answer can be traced to major differences between north and south in one fundamental that is key to the behavior of other processes, and also subject to unusually large and unexpected changes on a relatively short-term basis. That would be nothing other than the configuration of air pressure differences that form near an altitude of 500hPa and extend upward from there:
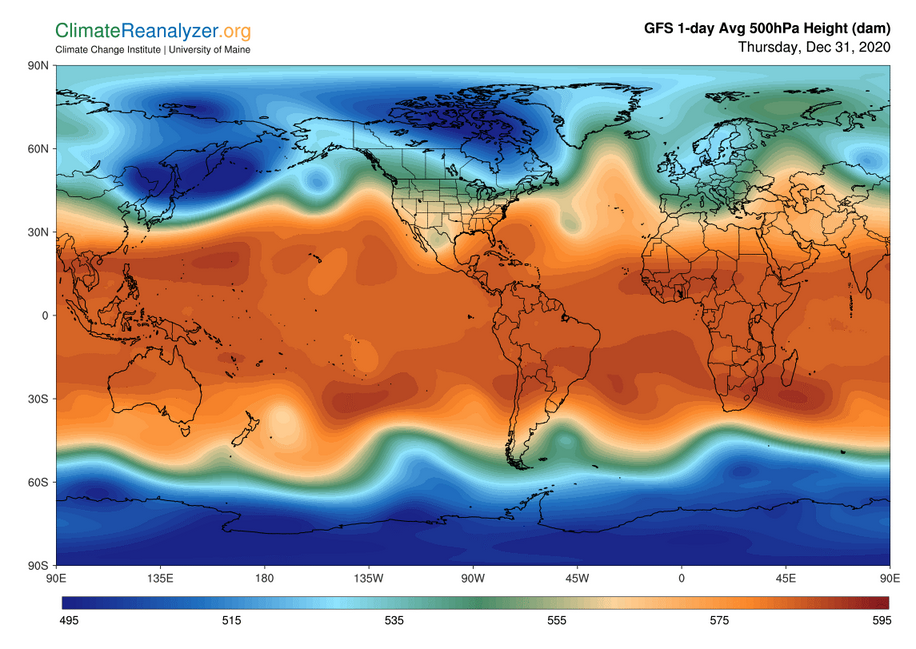
Why is this pattern so important? One big reason is because of the way differences in air pressure, whether it’s up at this high level or down near the surface, govern the positioning and strength of enveloping winds. At this level and above we are talking about rapid jetstream winds plus the lesser breezes that flow in spaces between the jets. They are all subject to placement related to specific air pressure gradients, and those gradients are set up in patterns that, by historical standards, can be either conventional of unconventional. I think the north has been submitted to an extremely disorganized pattern, as opposed to the south, and the jetstream winds that result are left with their own set of distortions. These distortions could be responsible for even more distortions that follow, of yet another type.
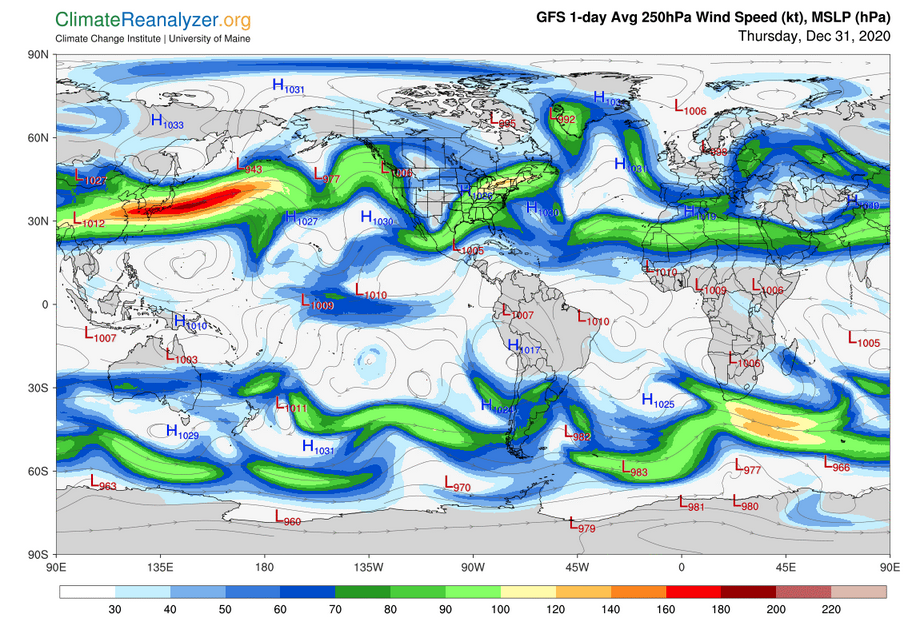
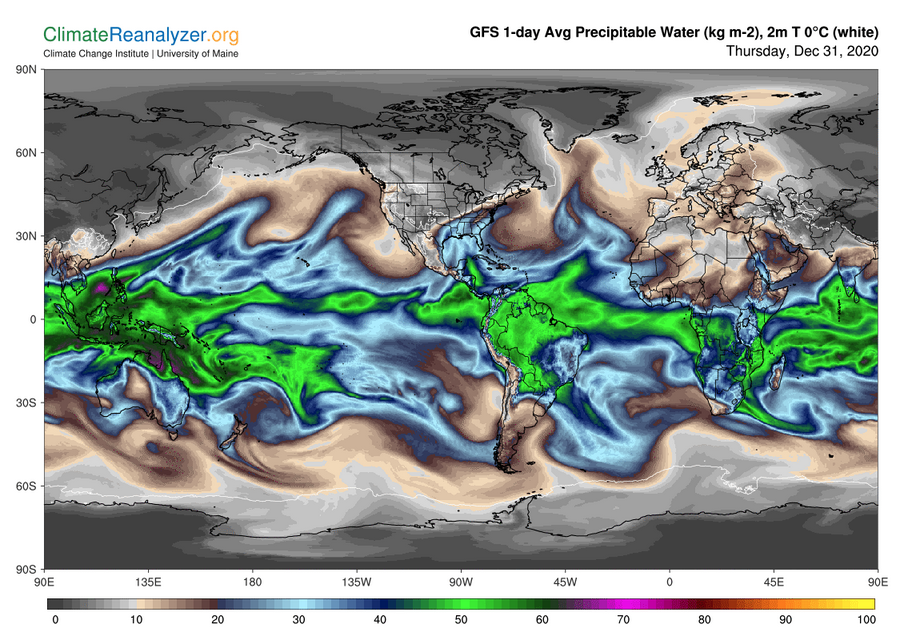
Jetstream wind positioning, especially with respect to the two major pathways inherent to the borders of the blue and green shaded pressure zones, is fundamentally important because of the way it controls the movement of precipitable water (PW) concentrations that regularly enter these high-altitude spaces. The distortions that exist in the north are allowing unusual volumes of PW to make deep penetration over high latitude surfaces, where the greenhouse-type of energy emissions they radiate are most effective when added to those of the relatively dry ambient air at the surface. This next map provides an illustration of this process at work, most effectively employing the heavy streams of PW that originate in warm parts of the Atlantic Ocean and Caribbean Sea. Overall, the scrambling of movement everywhere by the entire set of concentrated PW streams could be the explanation for why there are so many temperature anomalies of all types at the surface.
Carl