Another good day for map study, showing a number of different interconnections in unmistakable detail. It will start with the pattern that was set for high-altitude air pressure differences at and above 500hPa. The degree of disorganization for this time of year is best characterized as pure madness. The blue zone is supposed to be all in one piece, with a nice compact shape. Here is what we have gotten instead:
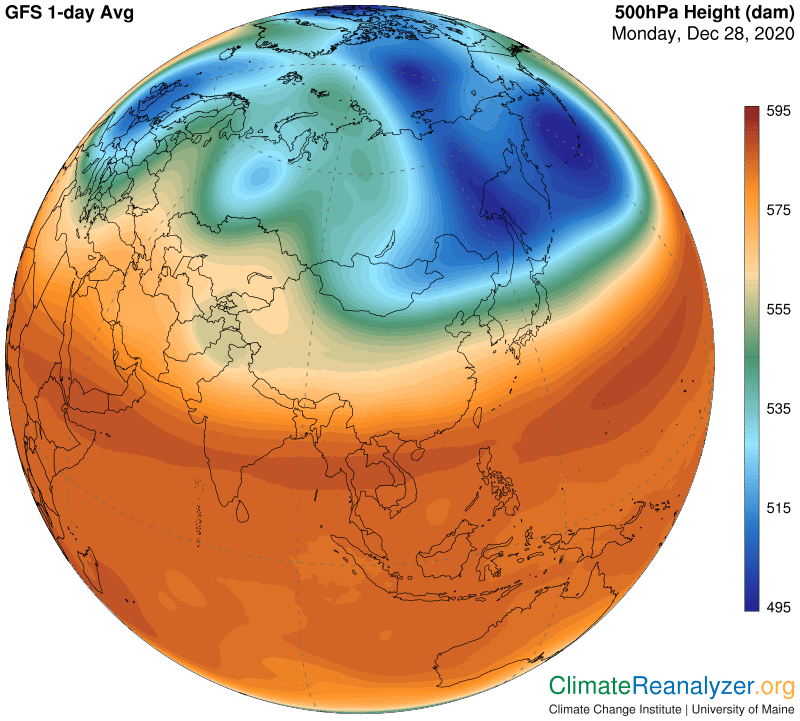
Jetstream wind positioning is entirely governed by the way certain different pressure gradients are related to each other in this configuration. The major, ordinarily single, pathway that normally encircles a compact blue zone has been broken up, so we are now getting extra pathways of more constricted shape. These display weakened and more variable wind strengths except in those places where many pathways of all types converge, which in one area is causing a strong stream of extraordinary width:
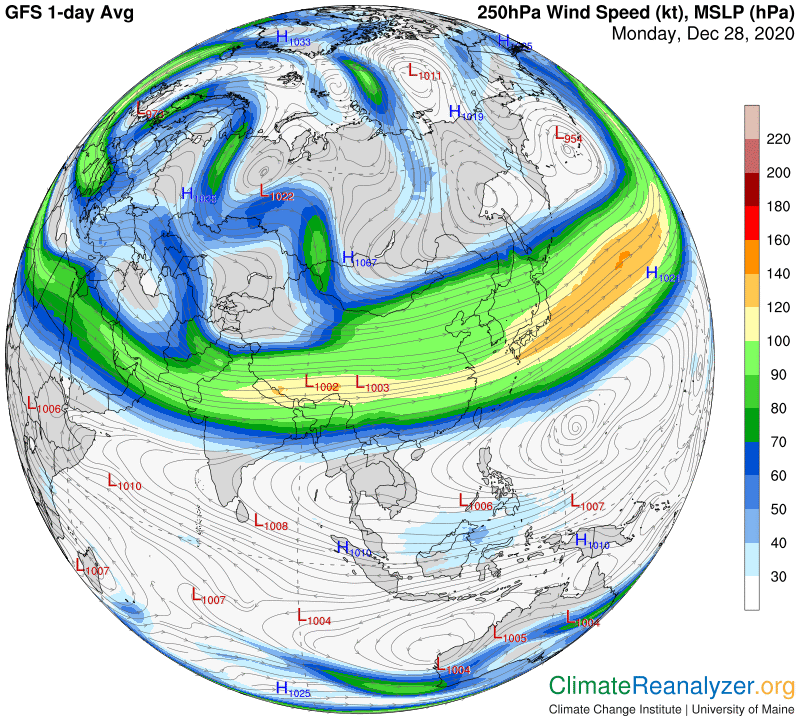
I really want to focus attention on the rather short leg of lower strength wind coming straight down from the top of the map as its path follows the left edge of the largest piece of blue zone before withering away. This leg is positioned such that it penetrates into the very heart of the polar zone, which would not be possible if the blue zone of associated air pressure had not been broken into smaller pieces. This jet only has moderate strength, but as it traveled northward, as viewed at the top side of the map, and would be seen better from another angle, it picked up a fairly good-sized concentration of precipitable water (PW) from the remains of a stream that was also heading north. Using magnification, you will be able to see that this batch of PW features totals of up to 5kg along the line of places where the jet has carried it:
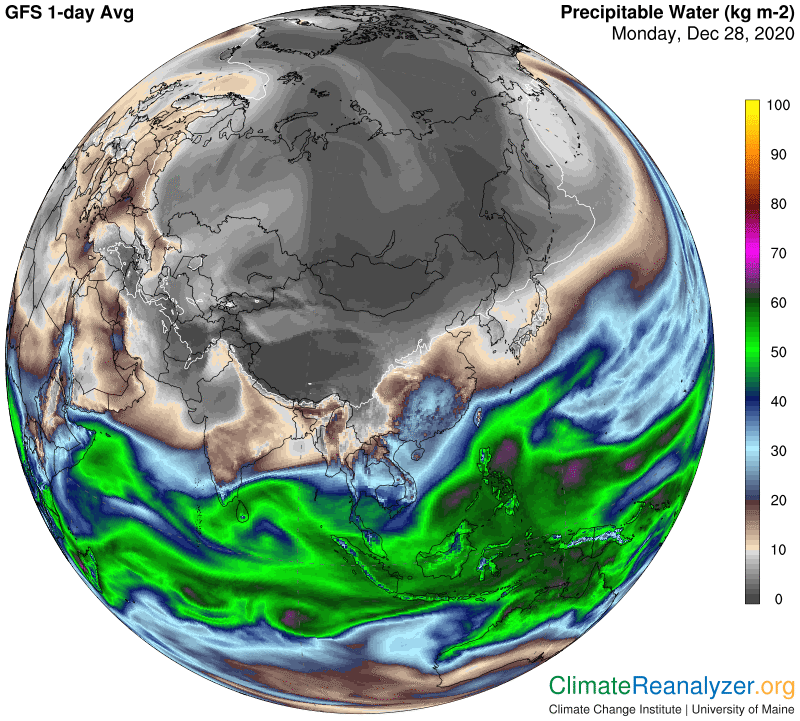
Now 5Kg is a whole lot of PW in a region that might normally see only a bit more than 1 at this time of year. If the normal supply of PW is around, say 1.2kg, then doubled twice, you could expect to see a warm temperature anomaly of up to +20C imposed on the air down at the surface. The total amount of greenhouse energy producing material in the full column of atmosphere above, regardless of altitudes of residence, is to all appearances what counts toward the blocking of outgoing radiation emitted from the surface. When surface radiation is extremely low, as in a place like this, it does not take much greenhouse-type obstruction to return enough energy to the surface to multiply its temperature by a significant amount. (But only as long as the agent of obstruction stays in place.) On this day we can see that the extra energy is worth a day-long average of up to 18 degrees:
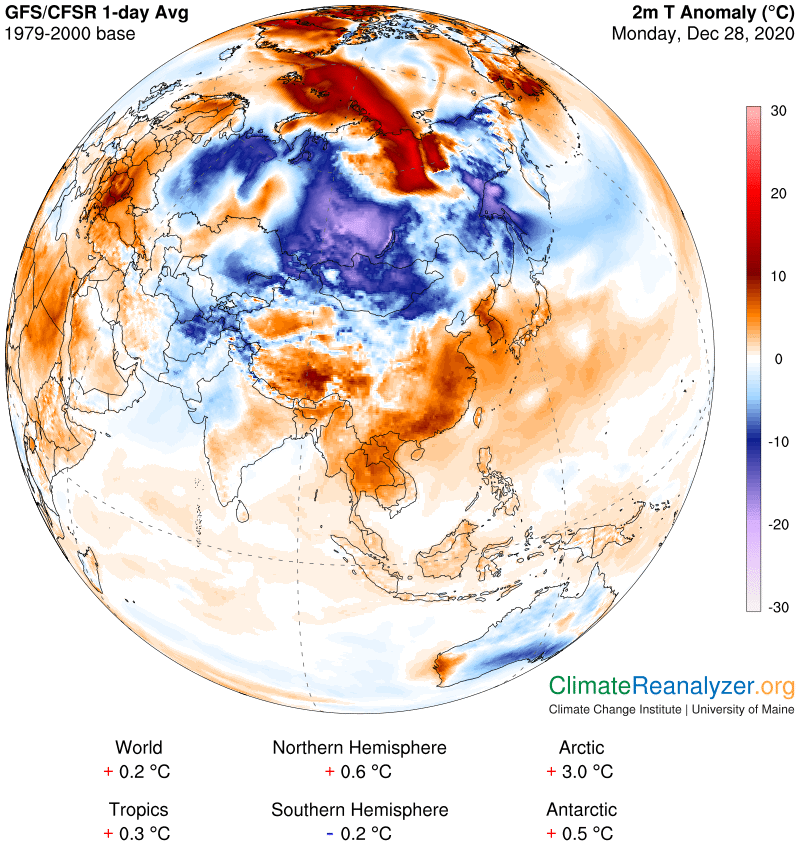
This image also shows us a few large regions farther to the south that have had the opposite experience and gotten deeply cold—up to 20C below normal. That would be the likely outcome of getting only 25% of the normal amount of atmospheric PW coming in to the sky above from outside sources. On the PW map I can see that current values have dropped all the way below 1 kg, which could mean as low as 500 grams or less. That figure is low enough to produce actual temperatures no higher than -40C, and is even happening in a place as far south as Mongolia. I had better show the temperature map for evidence of this extreme outcome:
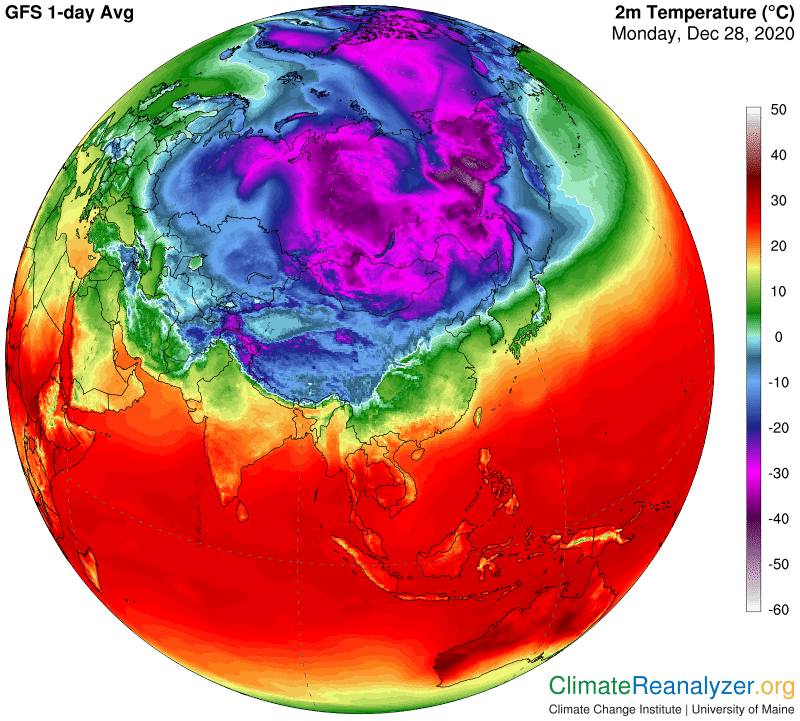
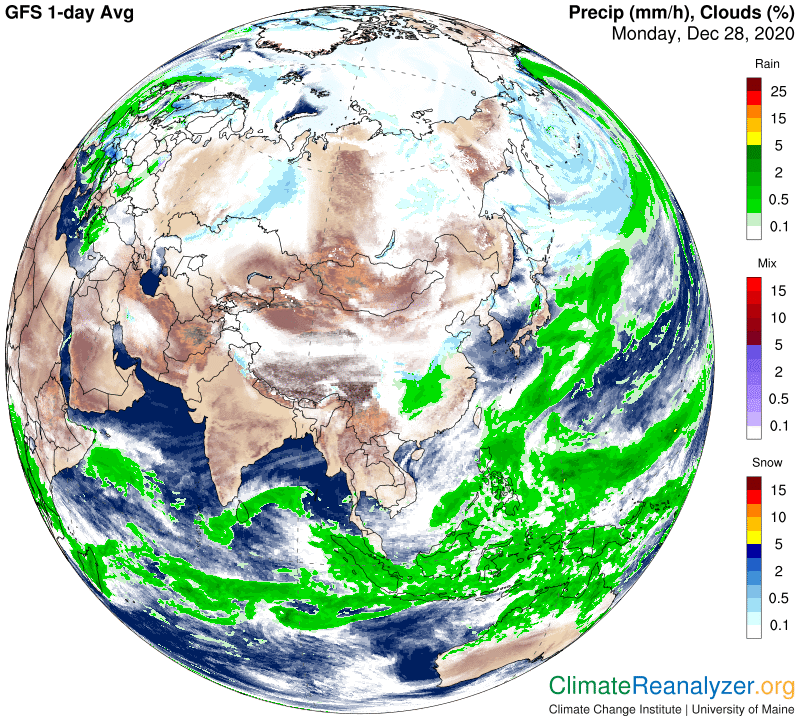
One more thing to notice from these images is that places much farther south are also affected in the same manner, but not as dramatically. Take a close look at northern India, which is on the edge of the tropical zone. And finally, one more map, showing the close connection between clear skies and low temperatures all over most of Asia at this time, as well as the exact opposite. A fascinating and rather common reality!
Carl