Editing note: Due to unexplainable technical difficulties, the outdated maps displayed here are not the same as those originally posted.
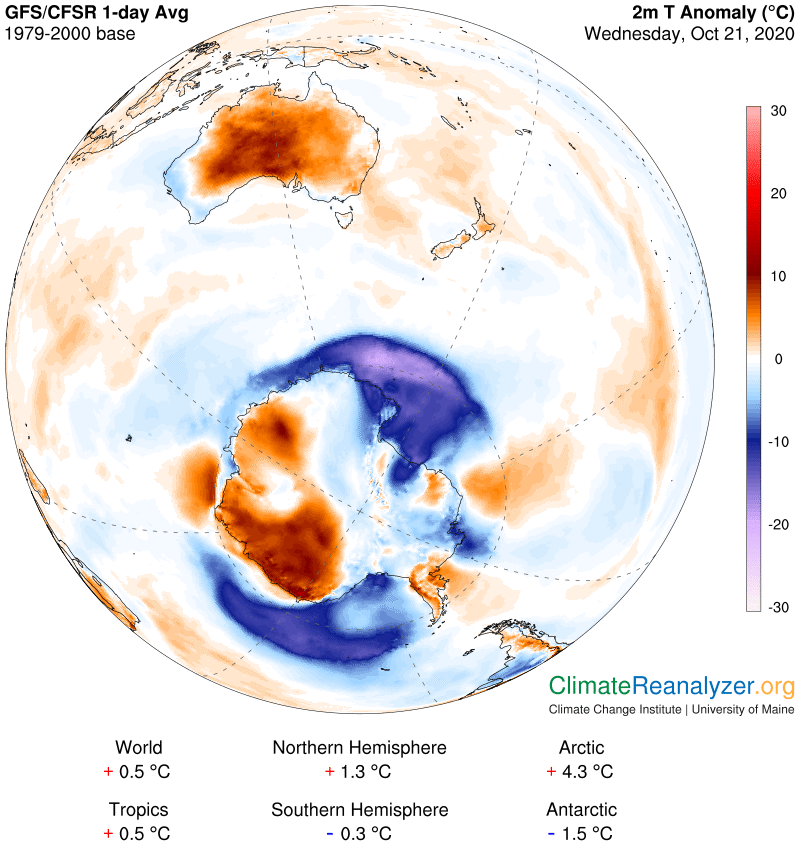
Today’s Weather Maps is having technical problems getting the maps updated, giving us an excuse to take a break from the Arctic situation and see how things are going at the other end of the planet, as of images from Wednesday. The polar zone is having a “heatwave” of its own, something like the one in the north except that it is sure to be short-lived and could not possibly do any real damage. Here it is:
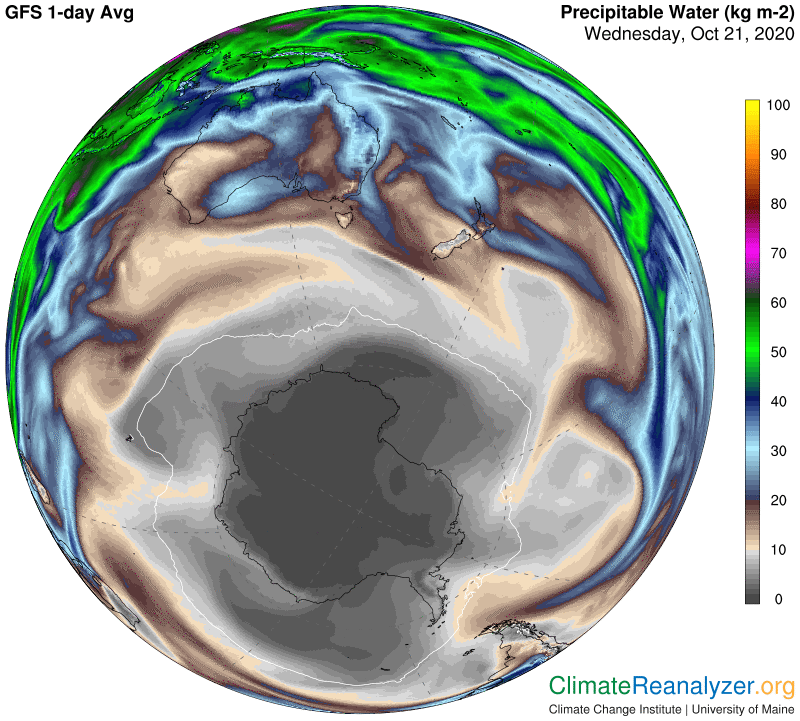
This event offers a perfect example of what can happen when a strong load of incoming high-altitude water vapor breaks through the usual barriers and is able to penetrate deeply as it aims for a passageway leading straight to the pole. Why the vapor has such an ambition is not for me to say, but that is invariably the story. On this image we are unable to see how far the vapor could continue in the late stages of its advance. This is because it has actually entered the “less than 1 kg” area of precipitable water vapor shaded in dark black, where measurements are not broken down into the lower units that actually exist. The vapor we see entering this area will probably have spread out, but then should have no trouble causing at least a double of ambient levels of vapor that could be less than one-half of 1kg. Remember the rule that each double, from no matter what level, is worth an additional 10C for air temperature at the surface beneath.
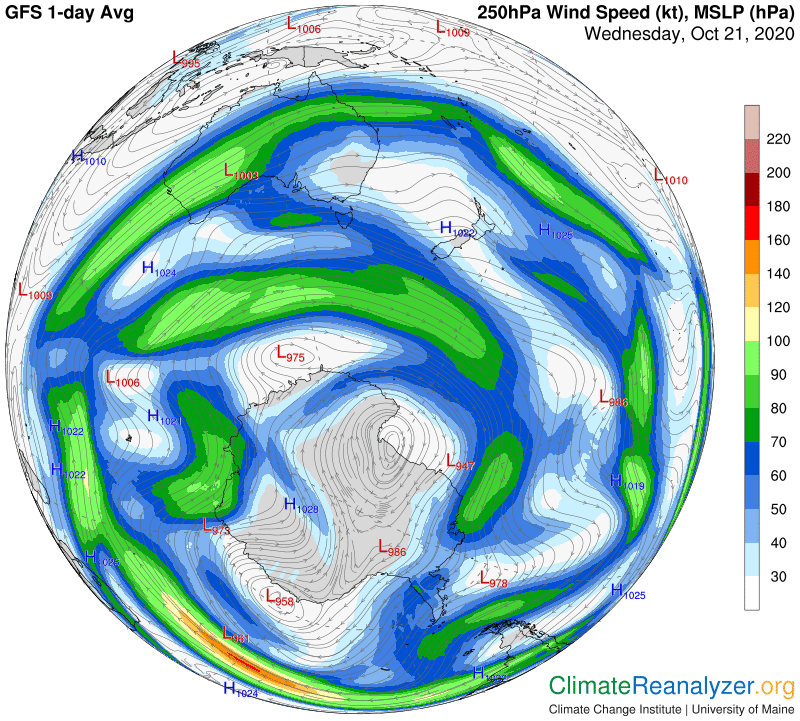
The “usual barriers” that I mentioned seldom turn out to be anything other than jetstream winds, so we’ll go next to that map. It looks like there are some breaks between the stronger jets that are allowing vapor to pass through and make an advance. The stream of vapor next reaches the side of a jet of moderate strength that, for reasons of its own, has turned and is headed in about the same direction as the vapor, which can latch on for a free ride. We are unable to see any of the details in these images except for the probable result, which would be the location of the strongest part of the anomaly in the image at the top.
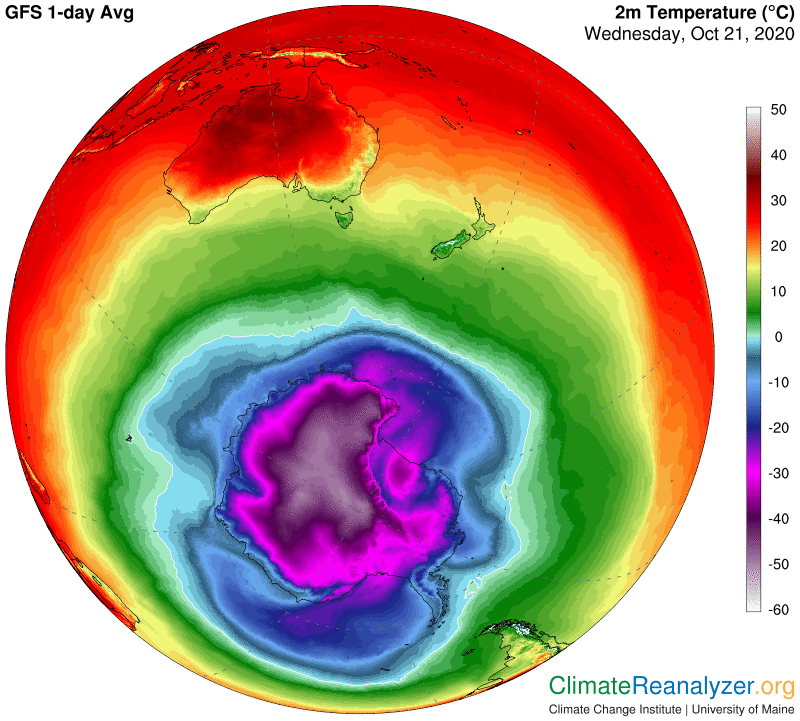
A map that shows the actual temperatures involved in this event is of use to us here. The magenta coloring that represents -30C will normally come close to matching the position of the border that outlines the zone of “less than 1kg” precipitable water. The coloring inside the zone gives us an indication of temperatures as cold as -50C, which can easily be verified by going to the Windy website at https://www.windy.com. Getting a physical anomaly of +10C through an intrusion of vapor is not especially difficult in this extreme environment. The effects are of no particular interest as long as they do not linger for too long.
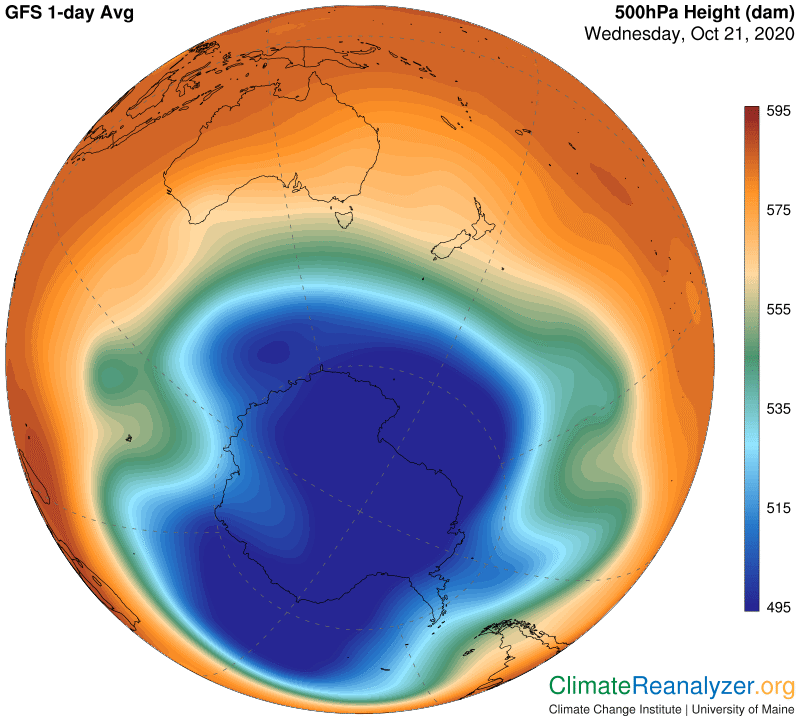
One more map, showing the 500 hPa air pressure configuration, is worth displaying today for several reasons. One is just for the sake of comparing to a comparable image from the other pole, as included in Friday’s letter. The more compact and robust pattern in the south gives it an overall edge in restraining the movements of incoming vapor streams. The weakest spot we see in this image is located exactly where the forces that actually do the restraining have been breached in this event, as observed.
Carl