Editing note: Due to unexplainable technical difficulties, some of the maps displayed here are outdated and not the same as those originally posted.
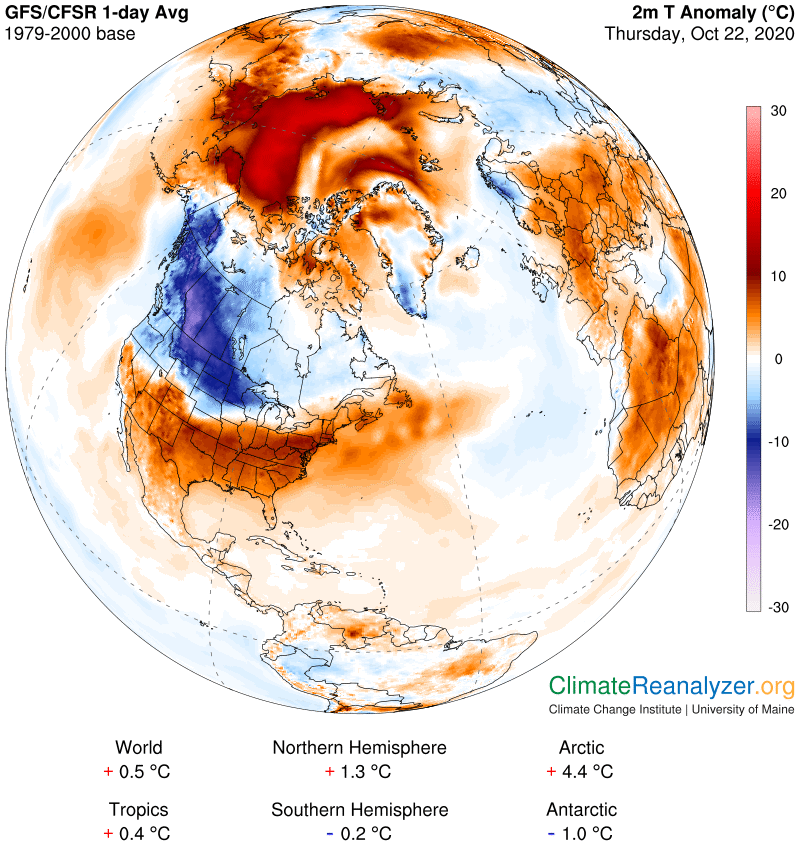
The North American cold anomaly deserves some extra attention because of its great magnitude, both in area covered and the extreme dip in temperature. On this image I see quite a large area in the center reaching to nearly minus-20C (-36F) in places. The map is also made interesting by the close proximity of the cold zone to an impressively large warm anomaly that is up to 8C above average over a wide area.
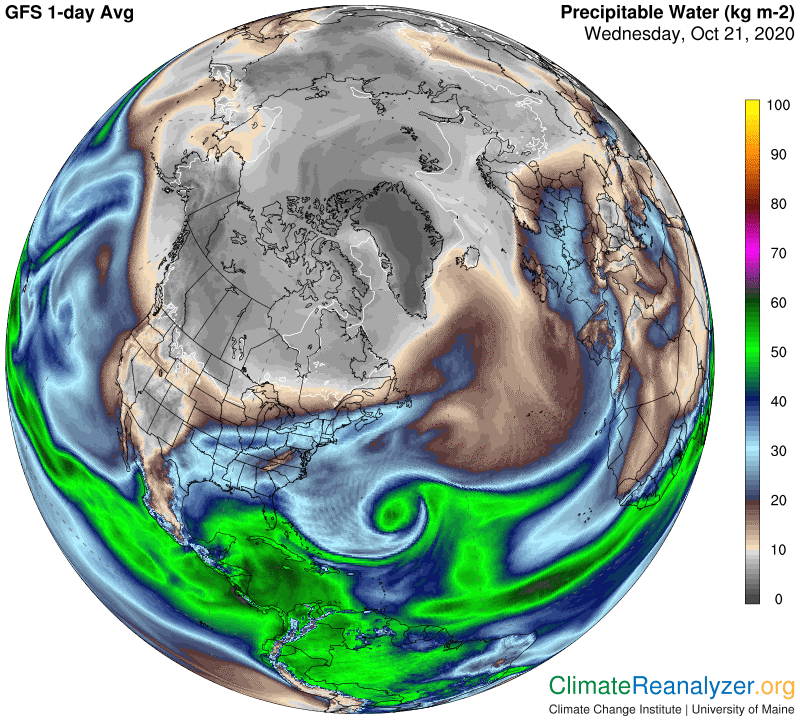
We of course want to know the cause of this unusual situation, and the best place to start—in my opinion—is by pulling up the Precipitable Water (PWat) map. If you know how to interpret all the different color shadings, then one quick glance will tell you we’re on the right track. Dark gray shades and cold air always go hand in hand. In this case what really stand out is the extra-dark streak that starts in Alaska and runs all the way down to the Dakotas, where a reading of 4kg can be seen, with kg lower yet in places a little higher up on the streak. Readings that low, at those latitudes, are only attainable when there is a virtually complete absence of any water vapor moving through the upper level of the troposphere directly above. The current situation is a real rarity, because vapor passage of some sort is an everyday occurrence. The actual daily average of high-altitude vapor thus becomes a critical component behind the temperatures we call “normal.” If the total PWat reading for the day is only half of average, because this component is missing, which is quite possible, you should expect the air temperature for that day to be around 10C below average, just as it is now in the Dakotas. Places having minus-20C anomalies, like we nearly see happening, would need total PWat readings that are only one-fourth the average for that day!
So why the low PWat readings over such a large area? We should all know by now that jetstream winds have a huge amount of influence on the movement of concentrated water vapor streams that have entered the upper part of the troposphere, so that becomes the first thing to investigate. This next map tells the story. Vapor streams that have reached the high altitude wind system all originated further to the south and are headed toward the polar region. High-velocity jetstream winds like the ones we see here regularly block or otherwise influence their movement. I have found that when winds that are dipping toward the equator, southward in this case, they are especially effective in resisting the movement of vapor streams approaching from the south. Northward moving winds will easily pick up streaming vapor and help to convey it toward the pole. (We saw an example in yesterday’s letter.) Winds on a parallel course need to be quite strong in order to fully block stream movement or may sometimes take over as conveyors moving to the east. The stream we see here was exceptionally strong when moving south, making it almost impossible for vapor to pass through to the other side. This was not the case at its upper end, near the Bering Strait, where a large amount of vapor found a clear opening into the ocean area, keeping the long-duration heatwave intact.
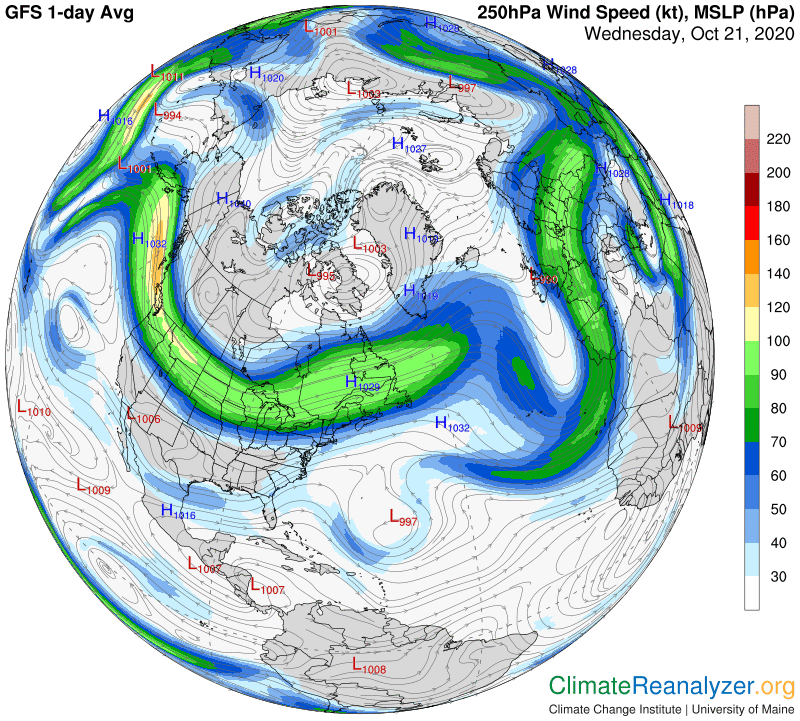
I should throw in one more map, the one that tells us where to look for jetstream wind positions.. This same map also reveals a great deal of structural weakness and fragmentation in the blue-zone section of the inner core. This weakness is what makes it so easy for fragments of numerous vapor streams to make penetration into the very depths of the polar zone one day after another. The body of smaller jetstream winds that normally patrol this area, some of which are seen on the previous map, are badly disorganized and largely ineffective as a result.

Carl