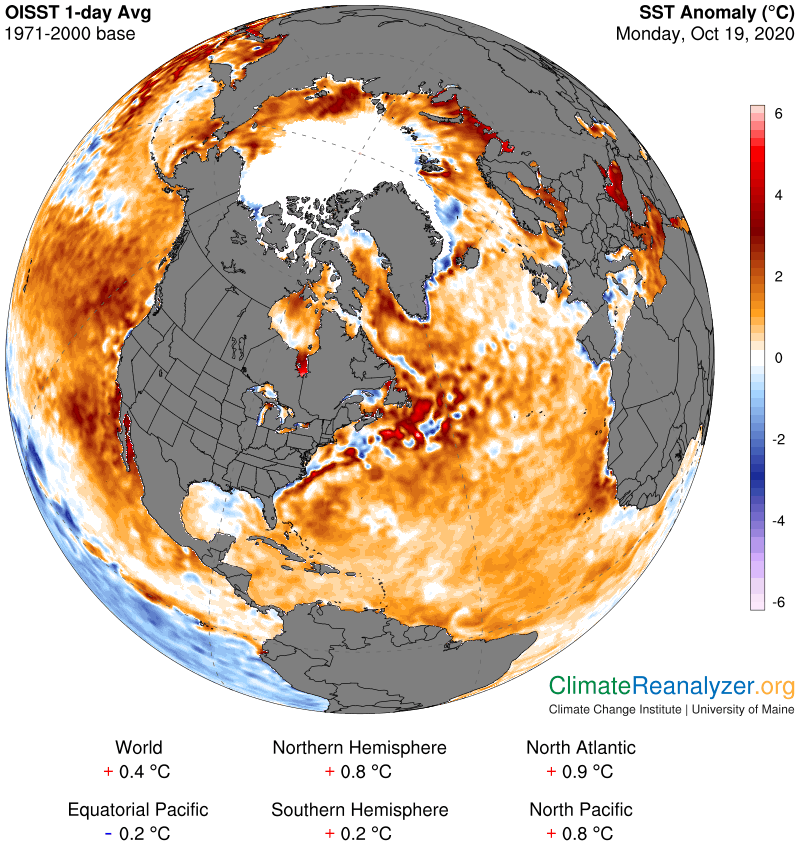
We want to know what is behind the heatwave over the Arctic Ocean, now almost a month old and showing no sign of relief. Today we’ll be taking a close-up view and also add an important factor that I’ve been neglecting, which is how to take into account the quite warm water temperature of the ice-free part of the ocean. This water, like all seawater, undoubtedly is absorbing and burying at depth a significant portion of incoming radiation instead of keeping all the energy near the surface in the way land or ice (after reflecting) would do it. That should hold down its warming, but such is not the case here. What if something other than incoming radiation (which includes greenhouse energy) is causing the water to be warmer? This is quite possible, especially in such an unusual location. Moreover, the exact same question can be raised concerning many other oceanic regions in the Northern Hemisphere. Arctic Ocean surface water, now averaging an anomaly of around +2C, is actually not that much different from the warmest seawater anomalies we looked at elsewhere in yesterday’s letter. Here is another view:

Next, we’ll make a comparison between the seawater anomaly and today’s air temperature anomaly, both in the Arctic. I think the sea surface heat must be adding something to the air temperature anomaly, perhaps a full two degrees, for reasons of its own that are uncertain. Having said that, I remain firm in the belief that the remaining balance of the current Arctic warm air anomaly is largely being caused by extraordinary inputs of water vapor, to be discussed later.

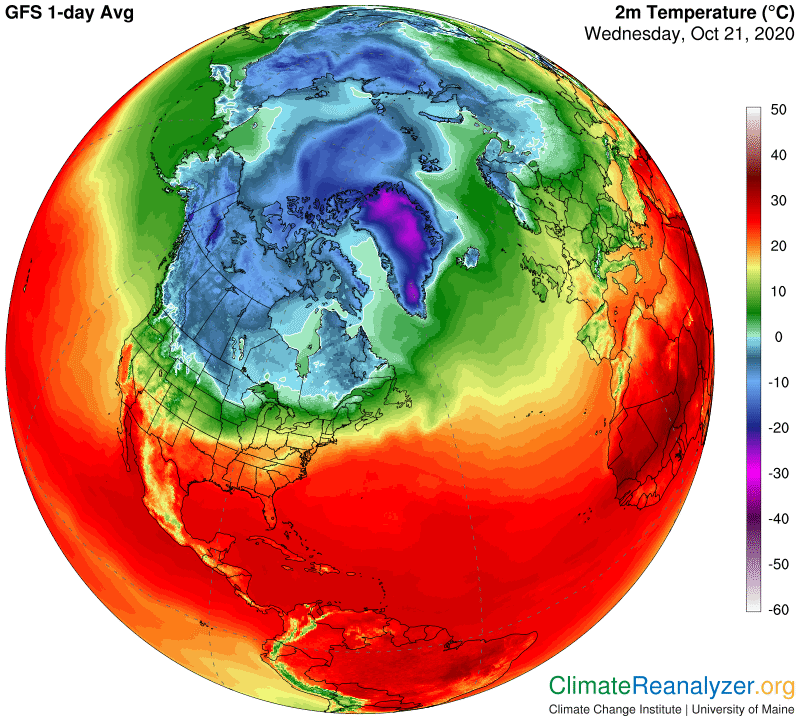
I still need to show two more maps that help to describe the total situation that now exists. The first shows actual average temperatures. See how the warmer and colder spots are placed over the ocean surface, and how the two warmer branches come together and meet at the top part. Also, note the large dark blue cold patch north of Greenland that has a light blue circle around it and a temperature of minus-20C inside the circle. Then observe how great the temperature difference is between that area and the warm branches that are so close to it. What could possibly explain such a big difference?

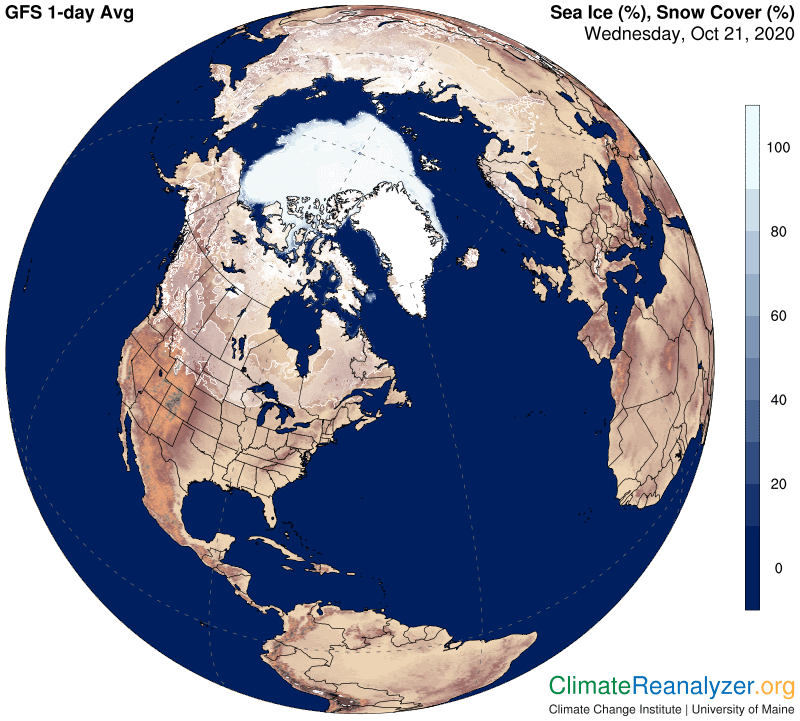
The dark blue patch we just noted is going to fit almost perfectly over the existing sea ice cover, as seen on this next map. Also, we get a very clear picture of an actual correspondence between the areas of open water and the warmest air anomalies, which has yet to be fully explained.

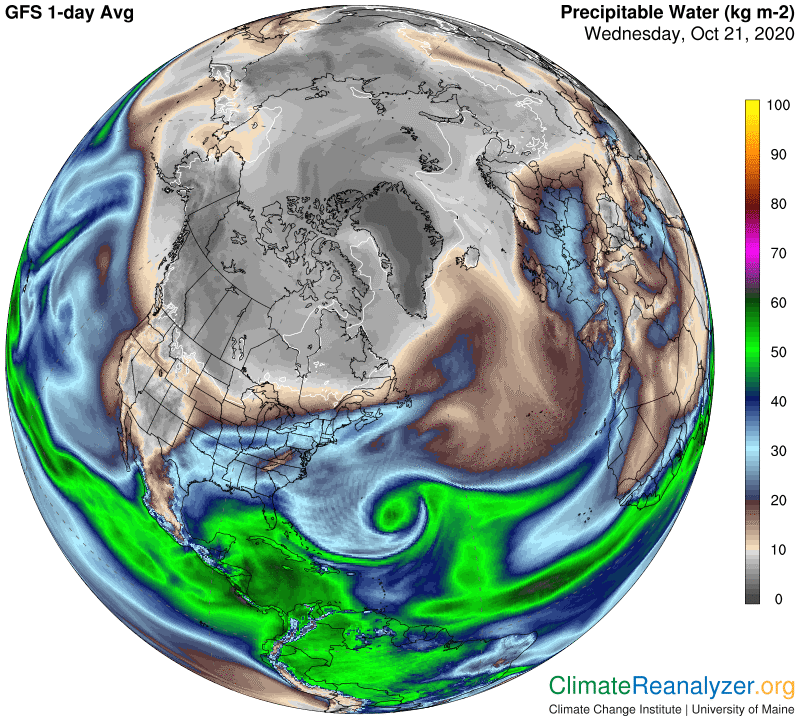
Just one more map, Precipitable Water, which contains some surprising bits of information. First, see how one large vapor stream is coming in from the Pacific, through the Bering Strait, and another from the Atlantic, north of Scandinavia, and how the two streams meet at the top. Both of them are truly in full concert with the warmest temperatures, which is expected. The streams also are acting like they have some kind of preference for traveling over open water, including Baffin Bay, and for generally avoiding the sea ice area on one side but not so much on the other. These last observations are a bit puzzling. They leave us wondering what to look for next.

Carl