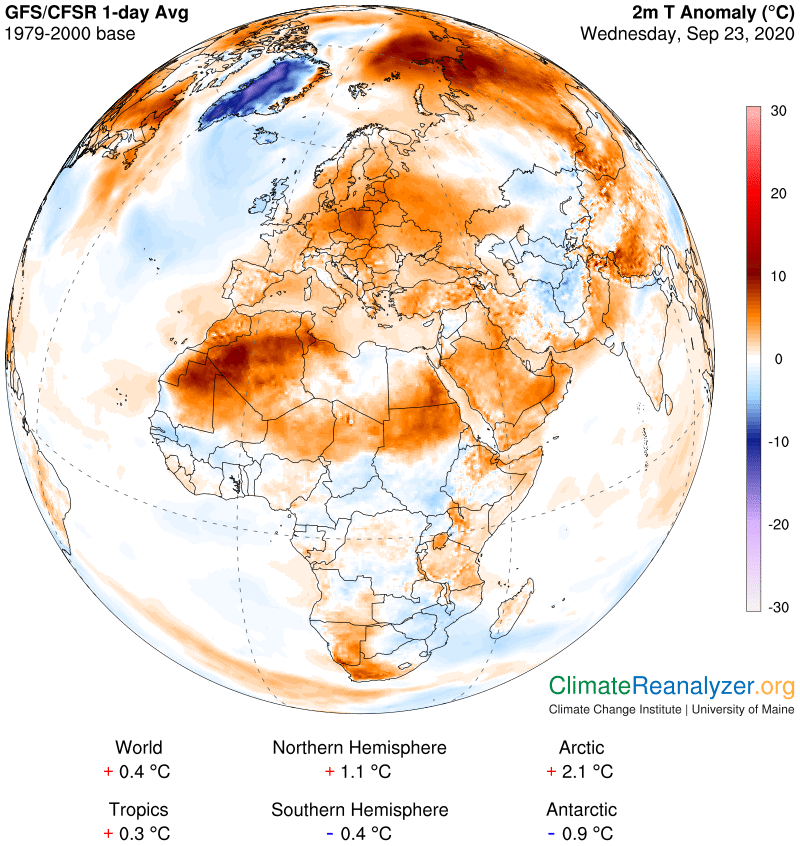
There is a rather large warm anomaly today covering most of North Africa, Europe and Arabia plus a piece of western Asia. It deserves a close look, more because of its size than its strength, which for the most part is no more than +5C. There are always questions to be answered about where all the extra heat is coming from, and why does the anomaly have such sharply-defined borders with most of its surrounding places?

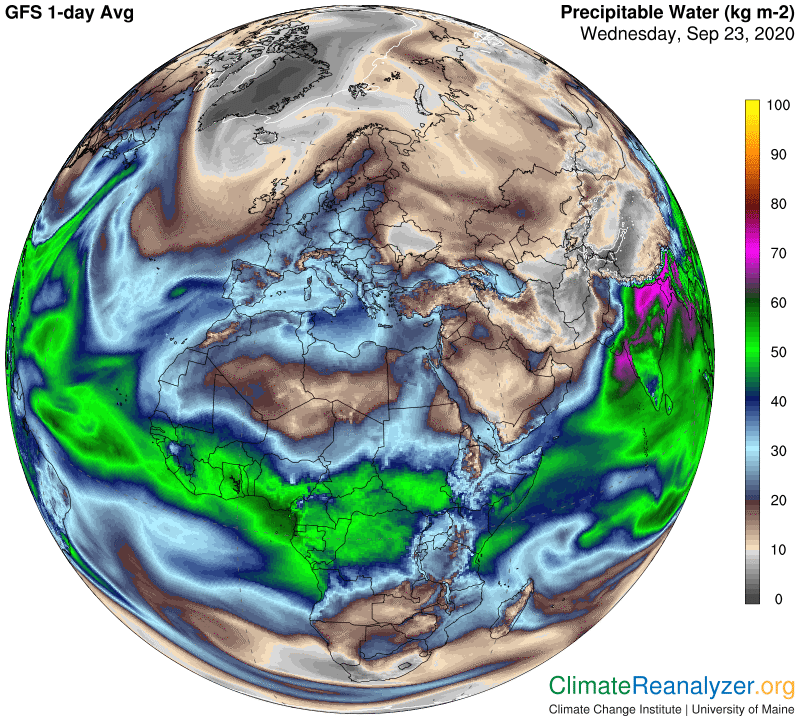
The Precipitable Water map gives us the kind of strong indications we expect for many of the answers. There is an unusually broad stream of vapor emerging from the eastern mid-Atlantic, a smaller but highly visible stream emerging by respiration from the eastern side of Central Africa’s rainforest , and likely contributions from the Mediterranean Sea, Red Sea and Persian Gulf. When I checked out the animated website of all these streams to see their 5-day histories at http://tropic.ssec.wisc.edu/real-time/mtpw I could spot still more contributions that originated in the upper western Atlantic and the western side of the African rainforest.

Whenever you look at the animated website you can’t help but realize how rapidly things can change from one day to the next, or even hourly. The Weather Maps do not always keep up with these changes in a perfectly coordinated fashion, leaving one to wonder why some things look out of sync. For example, while we can see here why the UK has not warmed up like the rest of Europe, because it has clearly been missed by all of the vapor streams, it’s likely that Ukraine must be getting more heat from vapor than the above map shows. Also, note how the central part of North Africa that shows no warming anomaly differs slightly in location from a region of similar size and shape on the other map that shows reduced incoming vapor. These occurrences are not unusual. Meanwhile, where we see the highest anomaly readings of all, those in desert parts of western North Africa, linked to water vapor readings of 20kg and more, we can make an inference of this region having twice as much vapor as usual in the air above, which easily explains the size of its anomaly.
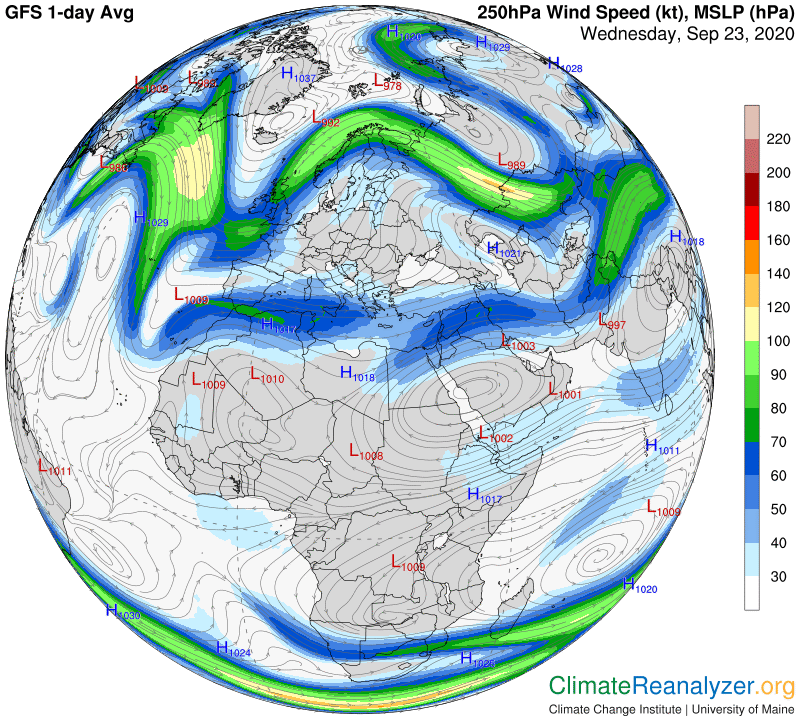
I still need to show why the overall shape of the anomaly is not an accident. The movement of high-altitude water vapor streams always comes under the influence of jetstream winds at the same high level whenever the two stream types meet, and this situation is no exception. The powerful winds on the north side of Europe create a cap that effectively stops further progress of vapor streams in that direction. The weaker jet winds running straight across North Africa, blowing from west to east, are more favorable for vapor movement. They do not block entry from the east Atlantic and can even pick up and transport vapors from any of the streams without much interference in the same direction they otherwise might choose to follow.

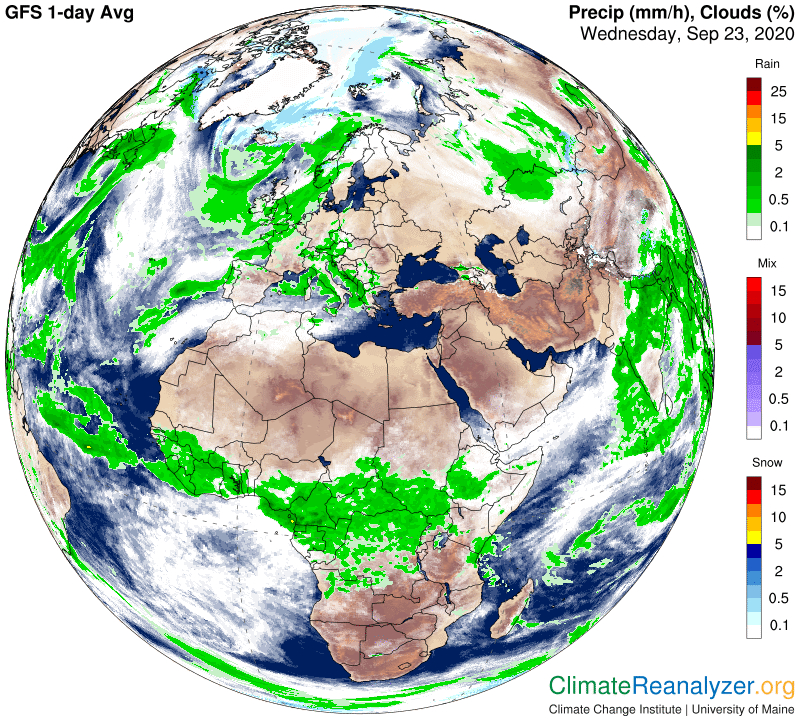
Lastly, the deep tropical part of Africa that lies south of the warm anomaly currently displays a combination of both cooler temperatures and considerably higher readings of precipitable water, which is being carried over land by winds coming directly off the Atlantic. The wide band of intense cloud cover and heavy rainfall that results, as seen on this next map, serves to effectively hold down temperatures. Skies are by contrast far more clear in most of the warm anomaly zone.

Carl