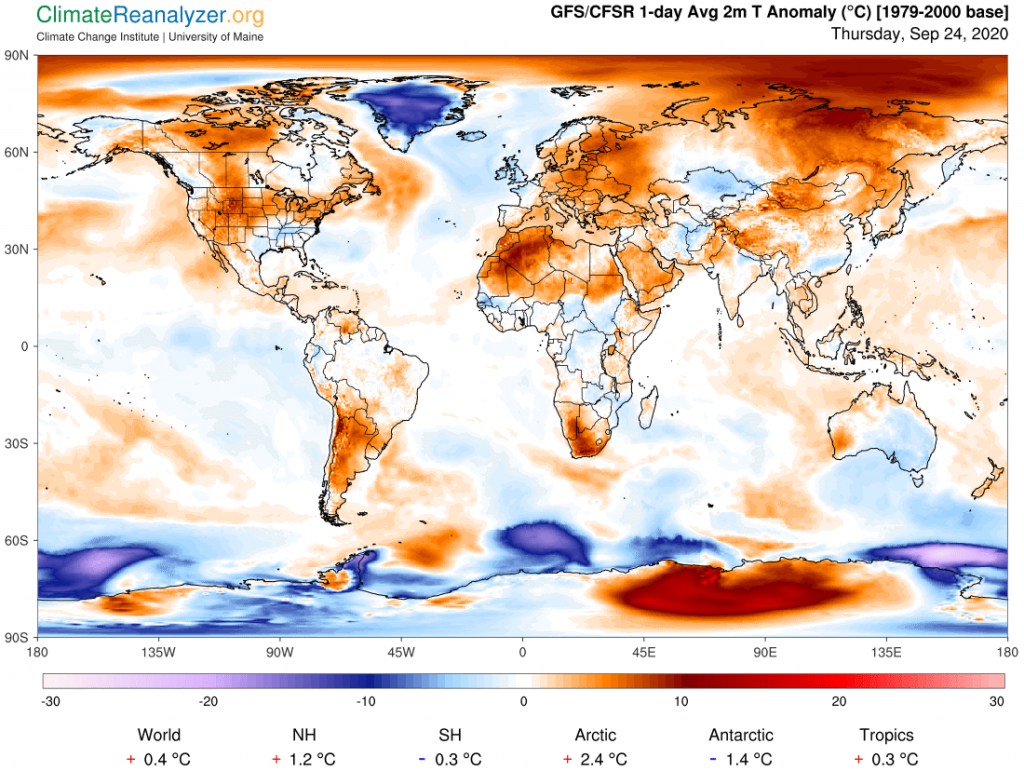
Today we’ll go back to the high Arctic region on the Asiatic side, where a strong anomaly of up to 10C has moved into the Arctic Ocean, stretching all the way to the North Pole. This is a different structure from the anomaly we looked at on Tuesday because the complete anomaly now has two parts, one above the other. The upper part has been created by the entry of a whole new source of heating energy while the lower part is still being fed the same way as on Tuesday.
When we open the Precipitable Water map we can see how things have changed since Tuesday, and from just yesterday as well. Vapor streams that have been reduced in size are now flowing much more freely from the European region into deep interior parts of the Arctic zone. These streams originate in roughly the same places that were identified yesterday but their continued progress is no longer being held back. This can be attributed to changes in the jetstream winds that we looked at yesterday, which have weakened a bit as their pathways shifted sideways by 100 miles or so to the east. Vapor streams coming off the western Pacific are still feeding warm energy supplies into the lower Siberian part of the anomaly image.
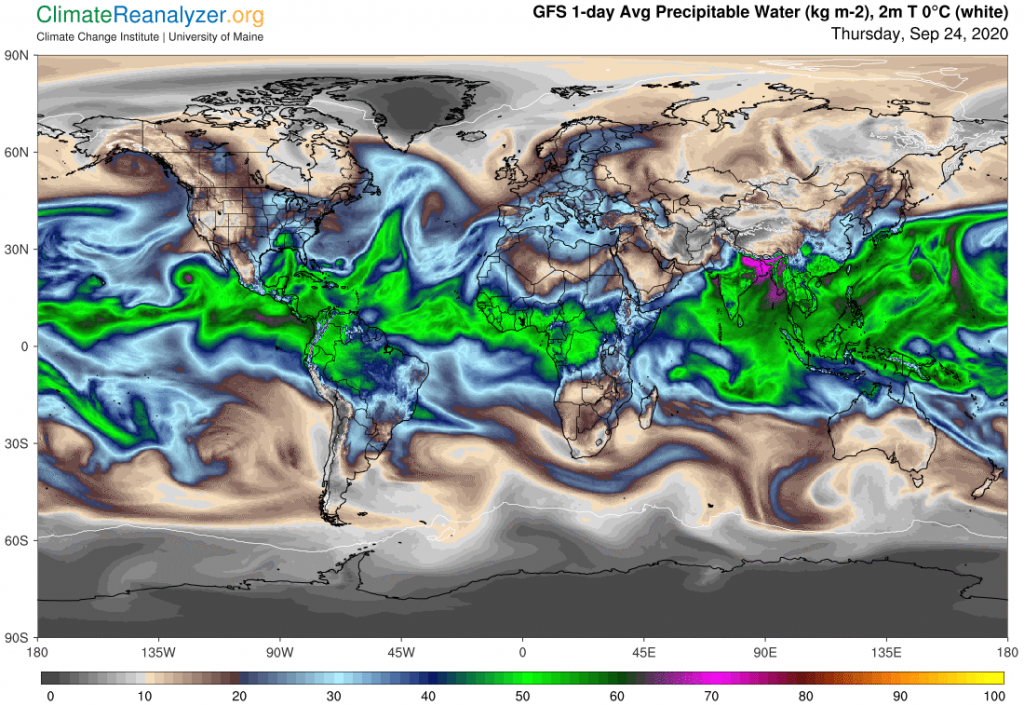
The total amount of vapor we are seeing in the upper part of the anomaly, around 10-12kg per square meter, is exceptionally high by Arctic standards. We know that much for certain, but what would the true normal average be for this date? I wish we had real data, but we can still make estimates. I can see a long dark streak west of Greenland on this map, at about the same latitude, that looks like it might measure 3-5kg for vapor. On the temperature anomaly map a streak in that same position appears to be measuring around minus 2-4C. In order to account for its coolness its normal average vapor measure should be a little higher than 3-5kg, perhaps 5-6? Anyway, the whole relationship between these two areas seems consistent with my general hypothesis that, all else being equal, any doubling of atmospheric water vapor (in a gaseous state) over a region will supply enough energy of the greenhouse type to raise the surface air temperature by about 10C, no matter what level serves as a starting point.
Polar regions are unique because they are so dry. Incoming vapor streams can be relatively rich in abundance of molecules, creating a great deal of energy leverage that makes it easy to double or redouble air temperatures. We have been seeing this happen on any given day around the South Pole. Now we can start looking for progressively larger and larger anomalies in the north as well as winter sets in and the surface keeps drying. Vapor streams that manage to avoid being blocked off by jetstreams do not seem to be bothered by the ordinary coldness that goes with any of the range of temperatures found at high altitudes, and thus their leverage can just keep growing in the winter season.
Carl