Every temperature anomaly has a story to tell. Something had to cause the anomaly to happen, and that cause is most likely itself an anomaly, behind which there are more causes and anomalies, etc., etc. In the case of a small short-term type of anomaly the principal cause may be hard to detect, but large ones can be quite easy if you have the right tools. Whenever a large anomaly occurs in the higher latitudes I’ve found that the flow of high-altitude water vapor almost always works well as a tool when you know how to look for it and how to measure it. Today we’ll look at one of the easy anomalies, a major in northern Siberia. The best view of this one is gained from the global map, keeping it in mind that proportions get badly distorted this far north. By chance there is a similar but less worrisome anomaly in the depths of Antarctica, almost a mirror image, which deserves a few comments as well.
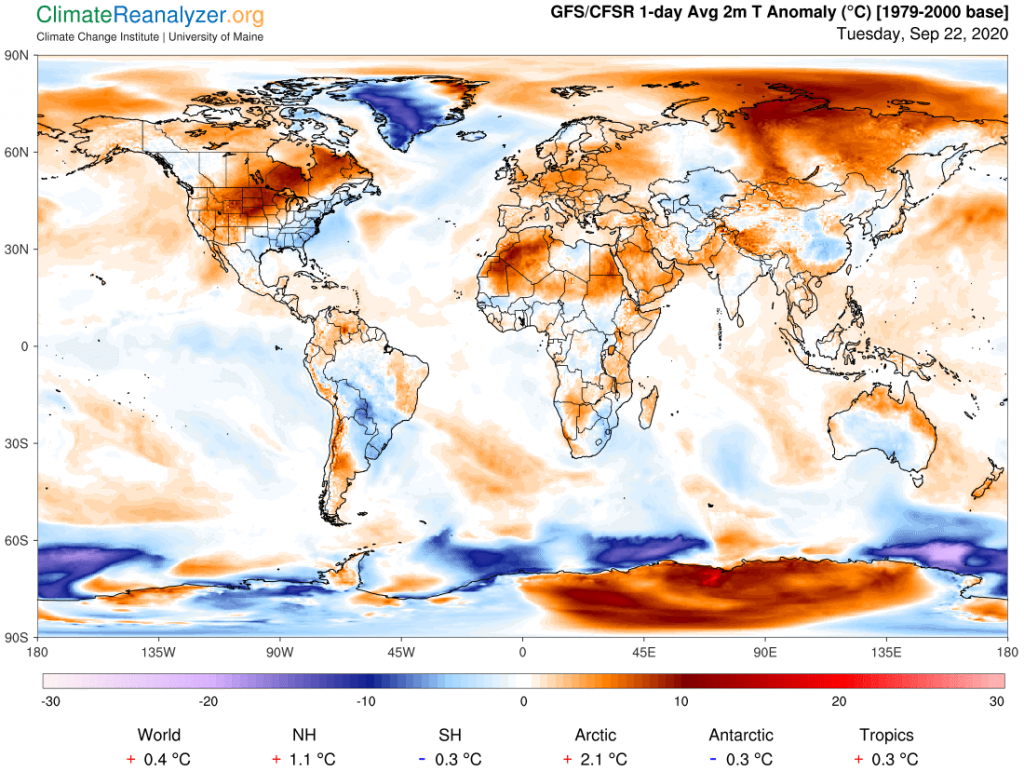
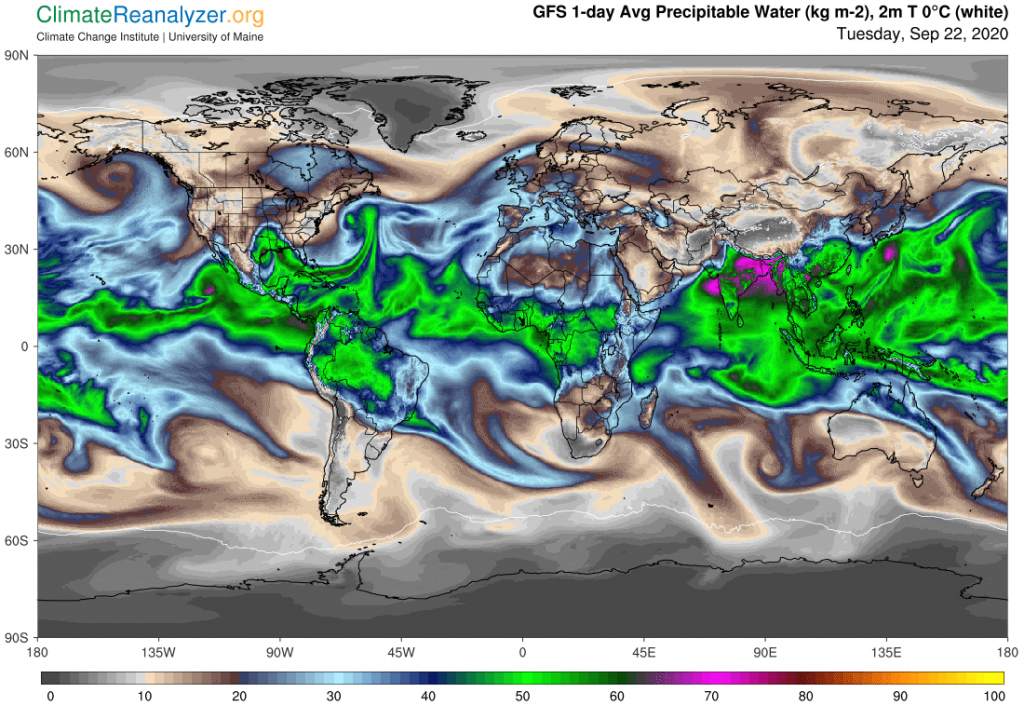
If we go straight to th Precipitable Water map we can immediately see readings that are a good match for the Siberian anomaly in area coverage, which suggests they must be applicable. Numbers up to almost 20kg seen in many spots are not normal. Normal should not be more than about 5-8kg at this time so having the effects of a full double is not hard to imagine, and would readily account for the observed anomaly of almost 10C. In Antarctica, on the other hand, all we know is that the reading is less than 1kg, possibly as low as 250 grams in the coldest places where the normal temperature is still around -50C. Only another 250 grams is then needed to produce a 10C anomaly but we have no means for seeing the true readings that closely.
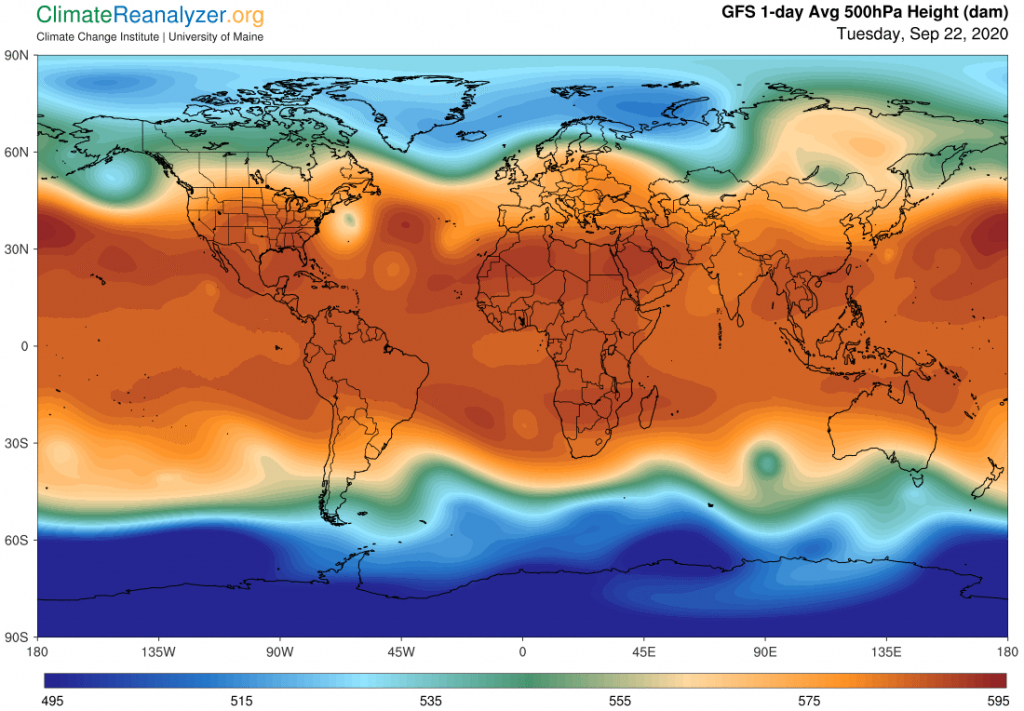
We still want to know what may have caused such a large water vapor anomaly in the north, if possible, and maybe even the south. Jetstream positioning is always a good bet for that, and since the positions of the strongest wind pathways always depend on high-altitude air pressure configuration we’ll go to that map first. The bulge you see in the north is truly an anomaly, at least when compared with the more southerly layout of the green zone elsewhere at that latitude. The jetstream pathway must naturally follow the green fringe, and could even be weakened at the corners of the bulge, allowing vapor to not only enter the bulge area but for some of it to slip on past, as we see happening in the map above. As for Antarctica, all you get is a small clue in the form of a weakening in the perimeter of the blue zone, directly south from Australia, which might somehow allow a tiny amount of vapor to slip in and slide through places where the blue shading is lighter.
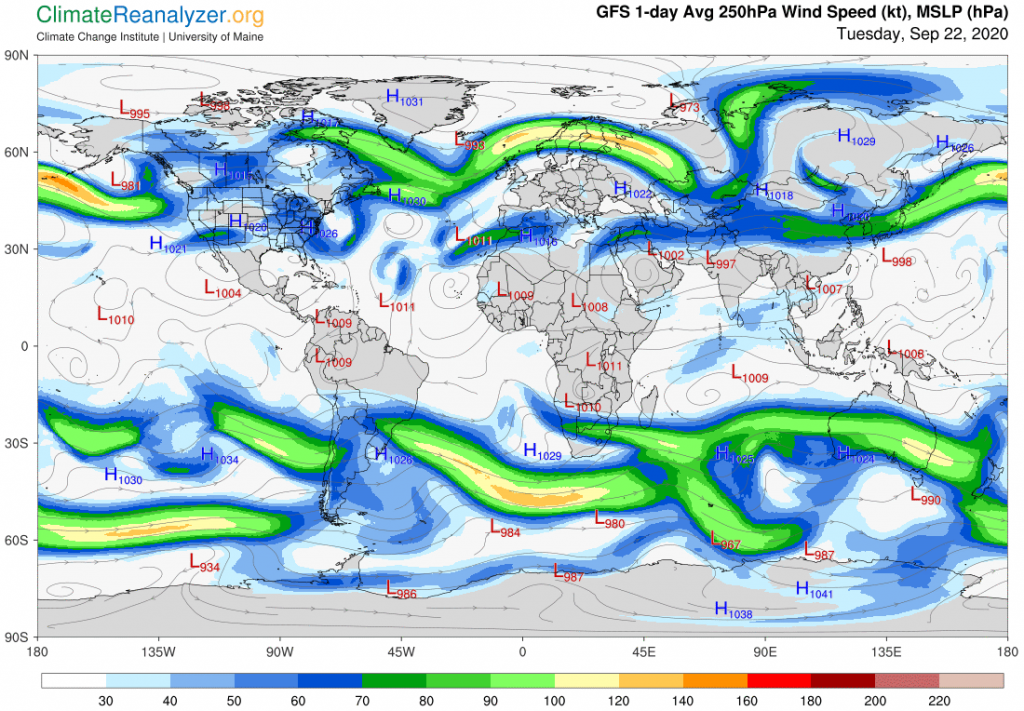
One final image is useful because it offers a perfect demonstration of regular jetstream behavior as it circles the bulge in the north and also an unusual glimpse of a weak jetstream at work inside the blue zone in the south. The latter is viewable in the lower right corner of the map, thanks to the new style of jetstream presentation with its extra detailing.
Carl