I am always looking for evidence supporting the idea that, all else being equal, any doubling of the total amount of water vapor in the entire atmosphere over a given piece of land area will raise the air temperature at the surface of that land by 10 degrees Celsius. This rule, together with every other possible means of temperature change, should be applicable to the explanation behind any observed temperature anomaly, anywhere, over any period of time. The rule should be easy to prove, but only if complete data is available, which unfortunately is often not the case. We normally have excellent data on current temperature anomalies as compared with selected base periods, and excellent data on current precipitable water readings, but not for how these readings differ from any base period or other useful norm. With no such knowledge in hand the best we can do is to look for ways to make reasonably good estimates. This is most easily done in high latitude areas where the largest swings occur. Today I found an unusually credible example in a tropical desert region.
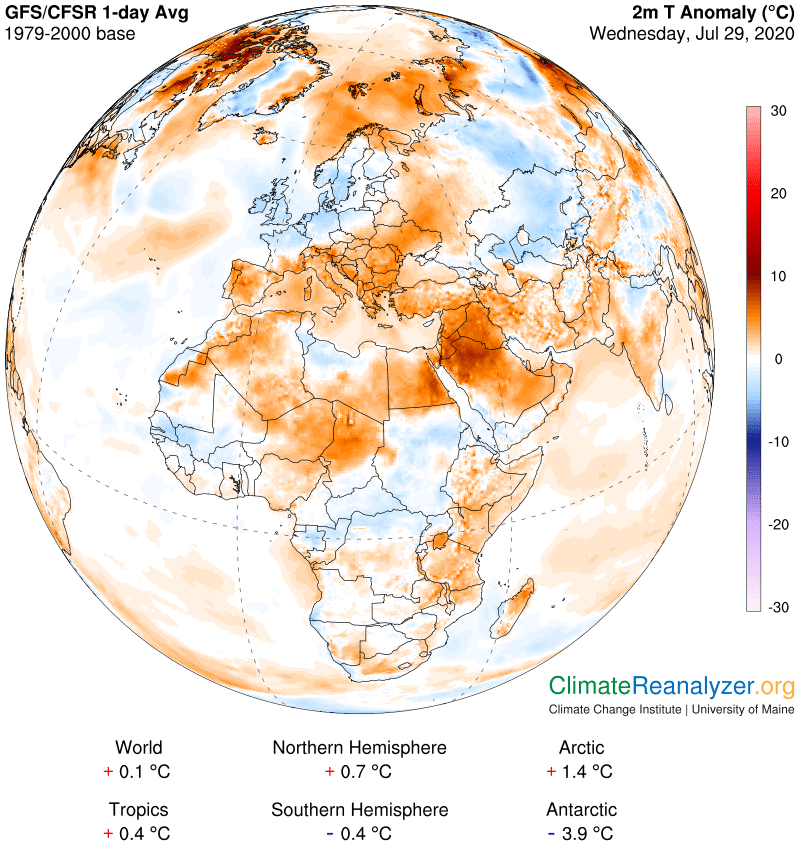
On this map of anomalies there are two in particular that can be compared in a useful way. One is a warm anomaly, averaging close to 8C, that is seen in northern Saudi Arabia plus some close-by territory. The other is the blue/white region directly to the west with a center in northern Libya, where the “anomaly” for an area of about the same size is between zero and minus 1.

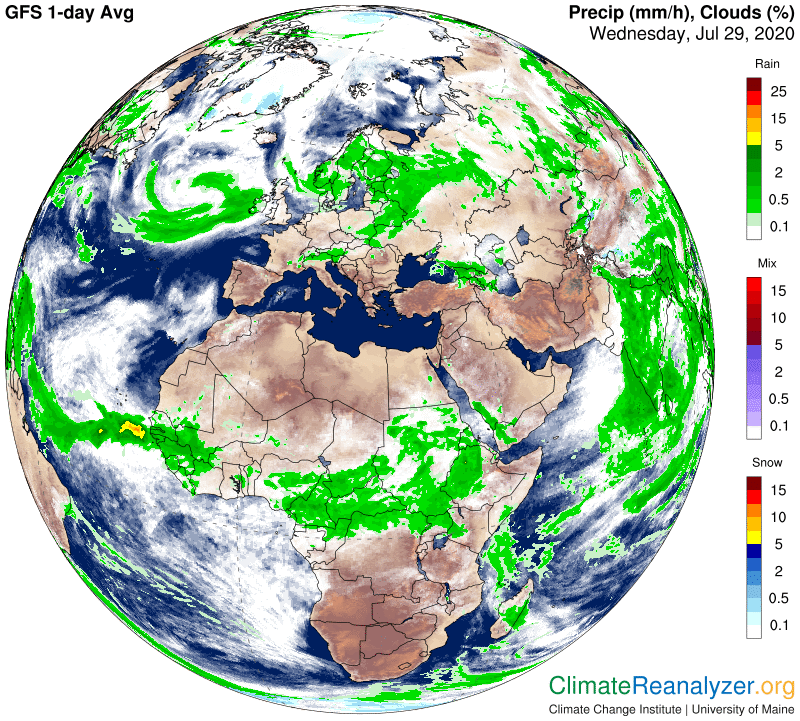
As we’ll see on the next map these two regions have a great deal of similarity. They have the same latitude and are both presently under a completely clear sky, which means daily solar input must be equal. They also have about the same kind of terrain, lacking much in vegetation, and generally similar elevations, shaded in brown on the map:

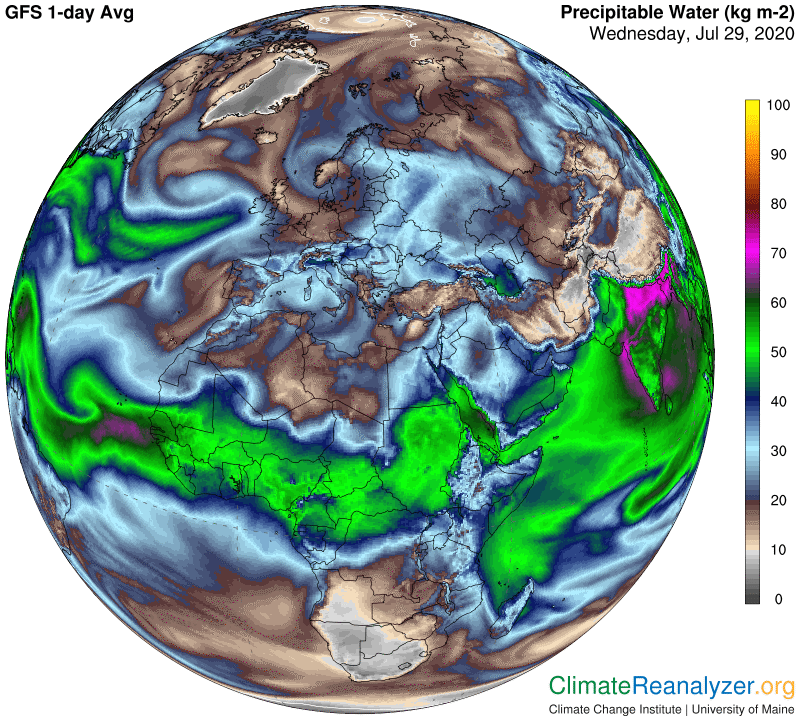
Given these circumstances, a question can be posed asking what the reason is for the big difference in temperatures (not shown) and especially the temperature anomalies. I did some checking on wind, which is not helpful, and then precipitable water, where major differences emerge. Let’s go to the map:

What I see is a reading as high as 40kg, averaging about 35, for the warm Saudi anomaly area. This one is easy to spot. The Libyan anomaly.is a little harder to pick out, but I think the average comes to about 18kg. Since Libya has essentially no temperature anomaly right now the 18kg number should also represent a fairly normal figure for this day. In the broader picture, Libya does not show any major streams directly overhead, while the Arabian peninsula is being generously infused from both sides. While nothing can be said for certain, I doubt that this is a normal situation for Arabia. I think normal would be much more like whatever is true for Libya, with the implication that the current reading is close to a double over the norm—enough to fully support the actual 8C temperature anomaly. It will be interesting to see how these two areas compare whenever conditions change in the days ahead.
As an interesting sidelight, an almost identical situation is visible today between two separate regions on the western Asian continent, at more of a mid-latitude near 50N. It would be too much to show in today’s letter, but I will save the images for another time.
Carl