The hottest spot on the planet these days. It’s the area in bright white I would judge to be about the size of the whole state of Nevada, covering a large portion of Iraq plus a piece of Iran. Maximum daily temperatures are running off the scale, meaning in excess of 50C, or 122F, which are tops for this map. Overnight lows are only dropping to about 95F. The same map shows a whole string of highs that are close to 120F lined up between India and the west coast of Africa. Inhabitants are not getting much relief; you will see a very similar pattern developing day after day if you regularly open this map: https://climatereanalyzer.org/wx_frames/gfs/ds/gfs_nh-sat2_t2max_1-day.png.
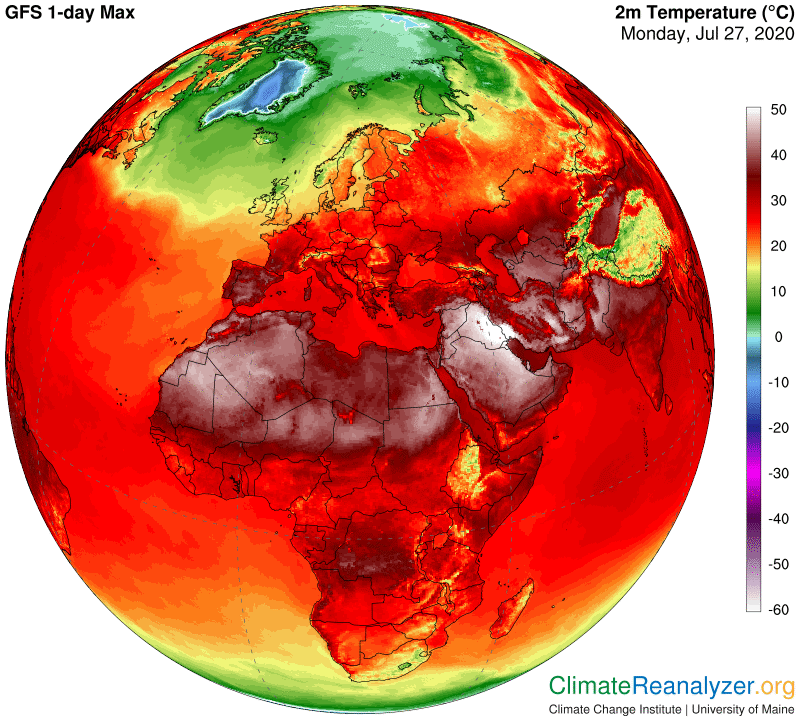
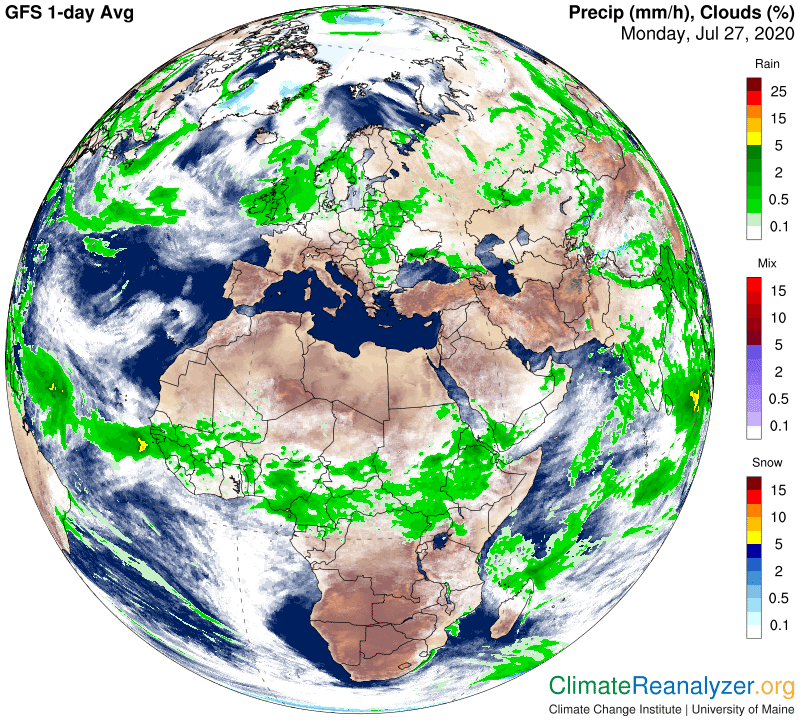
The reason behind the extreme zone of highest heat is not hard to find, because it all sits right at the north end of the Persian Gulf. The Gulf is not large, but it stands out as the world’s hottest body of water of such size or greater, now averaging 33-34C on the surface. This reading is no doubt due to its relatively landlocked position, adding about two degrees to what would be expected with normal circulation. Now I will open another map showing the almost total lack of cloud cover over the entire area of high temperatures described above, plus much of southern Europe that is almost as hot. Absence of cloud cover and high temperatures generally make good companions. In fact many scientists have been arguing that the two have a way of feeding off each other via mutual amplification, by observing that cloud formation is generally inhibited in the presence of high temperatures. Everyone already knows about the cooling effect that clouds have if and when they are present, and how the soil keeps baking ever hotter when the clouds are gone.
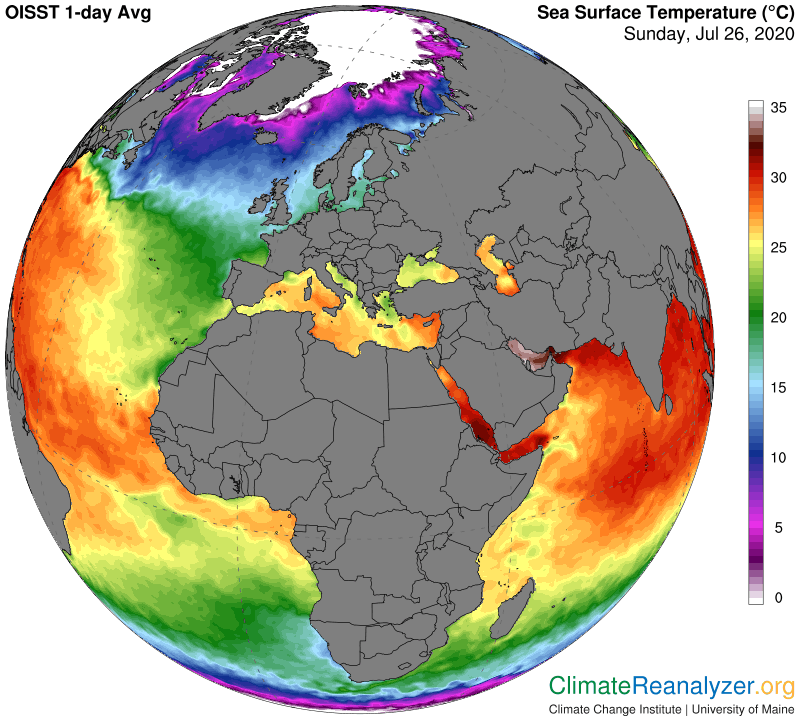
If this argument is correct, which seems reasonable, then the last thing you want to see is any other kind of positive feedback getting into the act. One of these could be started by the nearby presence of sea surfaces having temperatures high enough to send waves of evaporation to upper levels of the troposphere, where they could easily exist without condensing and then spread out over broad areas of the landscape below. I have many times demonstrated how phenomena of this type have been having an extreme effect on temperatures in the Arctic regions. The same principle applies in the tropics, although not to the same extreme because there is so much less leverage to work with considering the normal warmth of conditions down below. Any abnormality should still make a difference. For illustration, the following map shows quite an abundance of sea water with temperatures of 25C or more in this clear-sky region that can do the job, extending well beyond the effects of the Persian Gulf. Both the Atlantic and Indian Oceans contribute nearby portions that are warm and unclouded.
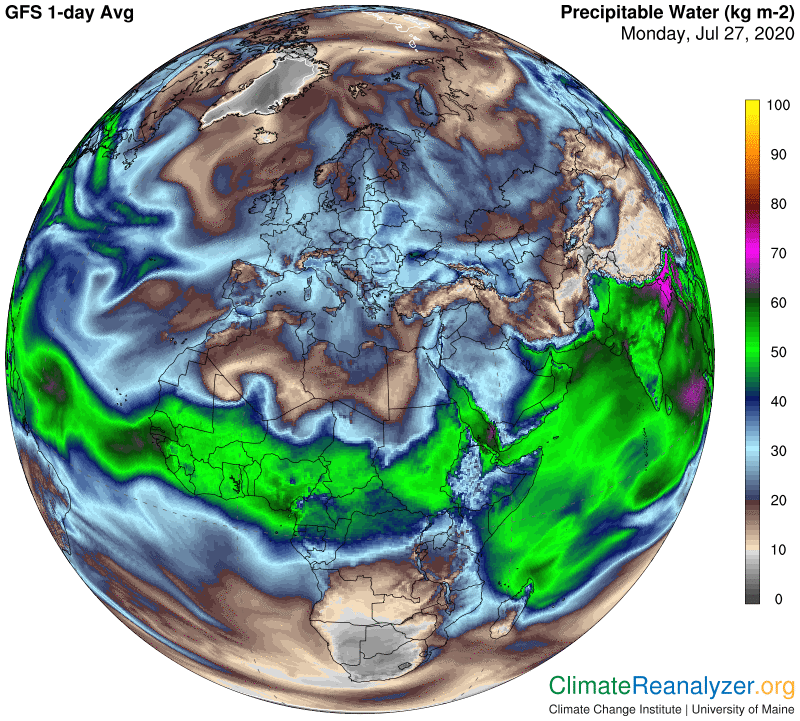
So what is the actual result with respect to the potential infusion of more than the usual amount of water vapor from this source into the atmosphere above this entire region? It’s hard to be sure of the answer because there is no handy source of baseline averages to draw from, comparable to data we have every day in the temperature anomaly charts. We can at least see from the next map that there is a great abundance of vapor in place, and we can see the temperature anomalies, but these are relatively smaller than the ones we are accustomed to in the far north and have other viable explanations that may be sufficient. One thing to take note of is the high value of the precipitable water readings above and adjacent to both the Persian Gulf and its near-counterpart, the Red Sea. This is where the greatest temperature extremes are located, so that may be a clue.
Carl