I spotted something of interest on the weather maps today that needs to be described even if some of the ideas tend toward speculation. It involves two separate streams of precipitable water, one that is heavily loaded with water molecules, the other more moderately but still quite heavy. The heavier one produces a band of extreme rainfall over a course of many thousand miles, a good part of which is over land. It creates a track of cold air anomalies over the entire distance, with the coldest being around minus 10C. The more moderate one follows a similarly long track, almost all over land, unable to produce even a little rainfall along the way because it bears practically no internal clouds. It can produce a number of warm air anomalies, with the warmest covering a large area having readings up to 15C. Both of these streams originate from very warm water bodies, but only the latter does so under clear sky conditions.
The most unusual thing about this story is that I believe the unclouded air stream not only rose to a considerably higher altitude than the clouded one but actually crosses over it at one point—not sure which came first, but that shouldn’t matter. Its direction is basically south to north while the lower one is more west to east. I suspect that the winds carrying each of the streams belong to two entirely different air pressure systems, as described in yesterday’s letter. Most of the basic information concerning this odd situation can be revealed on just three maps, so let’s get started. The opening map has been chosen because it draws initial attention to a really extreme picture of a high rate of oceanic evaporation that is having serious consequences in the heart of Asia’s monsoon region:
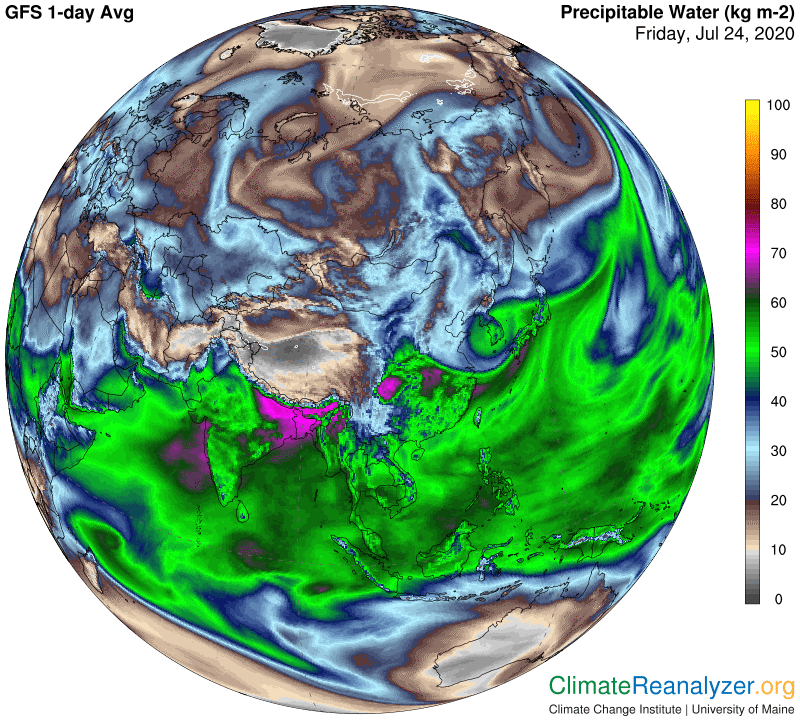
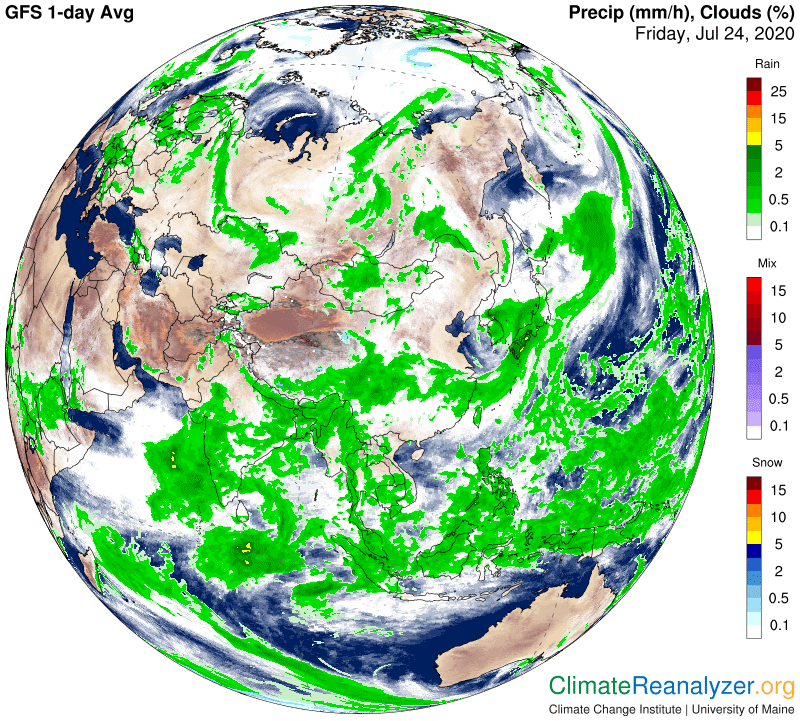
That bright magenta coloration over northeast India and Bangladesh, representing a full 70kg of precipitable water, is rarely seen over land with such intensity. It has reportedly produced catastrophically heavy floodwaters. The underlying cause is the convergence of extreme amounts of evaporation originating in large parts of both the Arabian Sea and the Bay of Bengal. You can then follow the stream through more magenta tracks for awhile as it moves into the Tibetan plateau region, crosses the center of China, heads out into the ocean, passes over Korea and Japan, plus a piece of Siberia, and continues on toward Alaska—maybe 8000 miles or more all told. This next map will show how the entire track is marked off by heavy clouds and amazing quantities of rainfall almost every step of the way:
And here we see the effect of this activity on air temperatures:
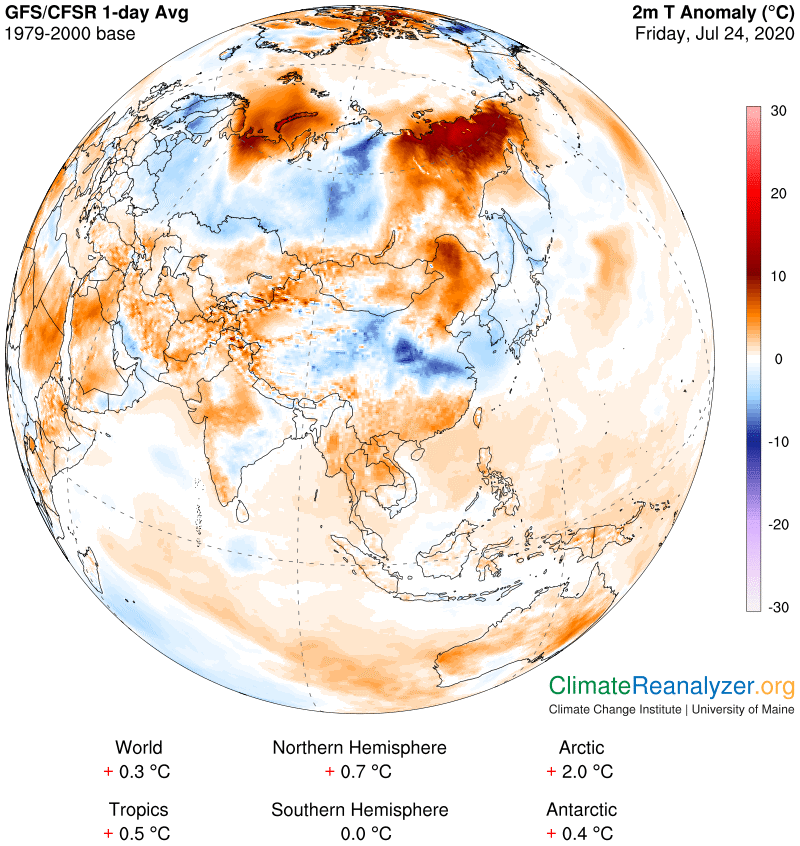
Now we can turn our attention to the other stream, using the same three maps but in a different order, because we first have to find a source of warm ocean water under a sky clear enough to open an unobstructed pathway to a very high level of the atmosphere. The one that caught my eye and best fits the situation is seen in the second map, located in the South China Sea. Its temperature is among the very warmest anywhere, and the precipitable water reading (top map) above this sea at 55kg or so is exceptionally high for any clear-sky situation of the type. The top map also displays a wide and strong stream of precipitable water heading directly toward the polar region from this area. If you look closely you can see how the reading of this stream becomes a bit intensified in the center of China and then suddenly declines, exactly along an edge-line where the other stream we have looked at is crossing China from the west as it moves toward the ocean. This is what tells me the two streams have indeed crossed paths, but at different altitudes. It may also be telling us something about why the cold anomaly over central China is so very, very cold at precisely that spot but I can’t think of a good reason right now.
Going back to the middle map you can see how the higher altitude stream suddenly became part of a completely cloud-free sky as it moved on and out of China and stayed that way as it continued on a path leading up to the shore of the Arctic Ocean. It may have received some vapor reinforcement along the way, keeping it close to a very strong 40kg or so right up until the end, which accounts for the powerhouse anomaly in the far north that we see in the lowest map. Thanks for seeing how fascinating this kind of study can be, and how real the effects are.
Carl