Last Tuesday I started writing about cold temperature anomalies and the next day I picked one out to follow and show images. As chance would have it, this one has done nothing but grow bigger and stronger every day since. As a result we now have what amounts to a substantial Arctic cold wave sitting right next door to the principal remains of the major hot wave that began last March and has stirred up so many anxious reports. Here is what these two look like as they stand today:

What could be the significance of such a turn of events, and are there any implications for my thesis about a temperature feedback loop? As to the latter, I have quickly found out that one more component must be integrated into the thesis, namely low cloud coverage. This turned out to be easily accomplished, with the help of images on the Windy website and numerous recent studies issued from the science community. Many climate scientists see possible losses of low cloud cover as the biggest remaining uncertainty affecting projections of temperature in their future climate models, and are seeking improvement in methods of resolution.
Low clouds have almost exactly the same kind of effect on global air temperatures as high-altitude water vapor, except that each works in an opposite direction. They are alike in that both have an erratic but extraordinarily strong impact on incoming radiation at the surface. When vapor exists at high altitudes, depending on the amount, which is highly variable, it has the potential to greatly magnify the local greenhouse effect being generated by other gases that are far more constant. When low clouds are in place, also highly variable but now mainly in terms of location and opacity, they have the potential to greatly suppress incoming solar radiation by reflecting it back to space. In terms of pure strength, as measured in watts per square meter, and given all the variability of distribution of effects by each, the two are competitive but low clouds may be on the losing end when future feedbacks are taken into account.
If my view is correct, high-altitude water vapor and low-altitude clouds both work their magic on their respective hot and cold temperature anomalies, by means of strengthening and enlarging of the anomaly, by employing one particular feedback mechanism. It is the same one I have been describing for last several months, but mainly limited to effects realized on the warm side. The high-flying vapor streams take advantage of weakened jetstream winds in order to gain penetration over territory where they have the greatest effect and are otherwise blocked from entering. Low clouds, on the other hand, take advantage of stronger jetstream winds precisely because those winds are capable of actively blocking the movement of vapor streams and their warming effect on air temperatures. Why is this the case? Because low clouds like to gather in places where temperatures are kept cool, preferably below 20C, just what strong jetstreams excel at doing.
This temperature information is best gained by studying the Windy website—https://www.windy.com—where everything is viewable in real time, but not amenable to copying. All one needs to do is to find the Low clouds link and the Temperature link and start making comparisons, everywhere on the map. The difference in low cloud presence above and below temperatures around 20 C is profoundly unmistakable, whether it be over land or seawater. And these clouds can even exist in places like the interior of Antarctica where the material they are made from, ironically water vapor, is extremely scarce.
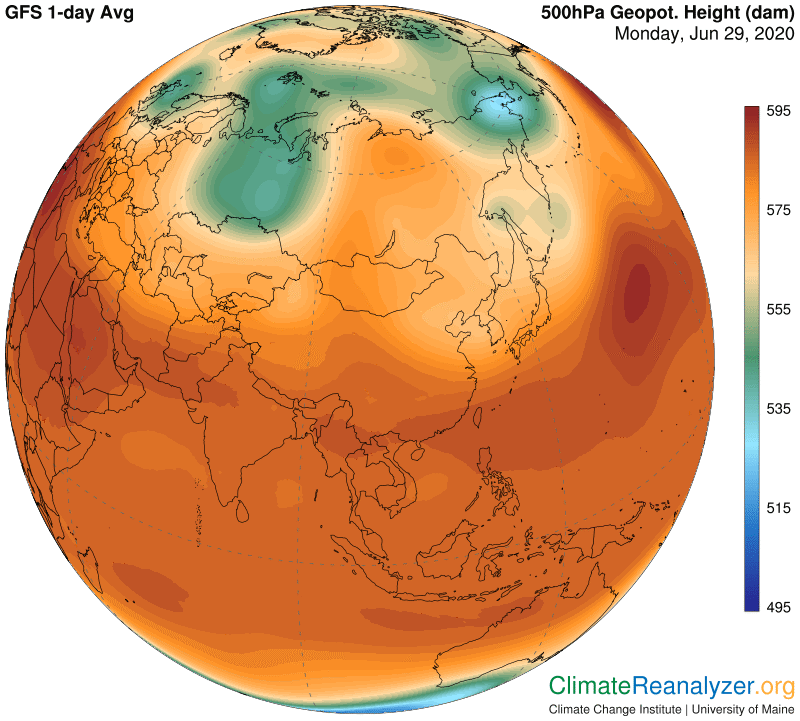
My temperature feedback loop thesis holds that actual cold and warm surface air temperatures have a direct impact on the configuration of air pressure differences at the altitude where jetstreams are formed, as based on direct observation of imagery found in the Weather Maps. Other images reveal how the resulting configuration establishes and defines the current location of jetstream pathways and much of their relative wind strength. It would be of interest to me to know if the configuration imprint is in fact new to science, if anyone can give that answer. (My email address is at the top.) For reference, this is what the configuration looks like today, which may be compared with the first image in this letter as an imprint-maker. (Real temperatures, as opposed to anomalies, are equally effective, if not more so.) Similar comparisons are available in previous letters.
Carl