An update on my special theory concerning a temperature feedback loop fed by streams of high-altitude water vapor. The development of the theory was not really finished until June 15th, when the final touches were described in CL#1700, followed the next day with a summary of the main components. The whole process began several months ago, when I was searching for an explanation of what was causing the sizeable warm anomalies that were continually appearing on the weather maps, particularly in the upper part of the Northern Hemisphere. I concluded that water vapor was the only agency that could produce anomalies all the way up to 20C in some locations, and doing so repeatedly. Moreover, although somewhat lower in strength, many of these anomalies are being sustained for days or even weeks, suggesting the presence of causation that is more than accidental, yet not readily apparent A somewhat complicated and unfamiliar feedback mechanism then came into view, involving a sort of “star wars” competition between opposing forces encountering each other in two completely separate venues and two completely separate sets of combatants, all going on at high altitudes. The theory has not yet caught on, which is understandable, but I am confident that it will some day. In my opinion there is no better explanation for the extreme warming trend that is now devastating the Arctic region and causing so much concern. Here for example is a story that appeared in The Guardian yesterday, typical of many others with a similar message, none of which ever single out water vapor as the primary force behind the observed outcome: https://www.theguardian.com/commentisfree/2020/jun/25/arctic-heatwave-38c-siberia-science:
Meanwhile, I have felt the need to consider some of the broader implications of the theory, which should generally apply to the entire planet under a wide variety of circumstances, and be reversible. We certainly see cold anomalies popping up all the time, right alongside the warm ones, some quite strong and durable, and each one of them must have a plausible explanation for why it has come into existence. The idea of their development possibly being subject to participation in a feedback loop cannot be avoided. The one I called attention to just two days ago is an example, so let’s take another look by making a few quick comparisons.
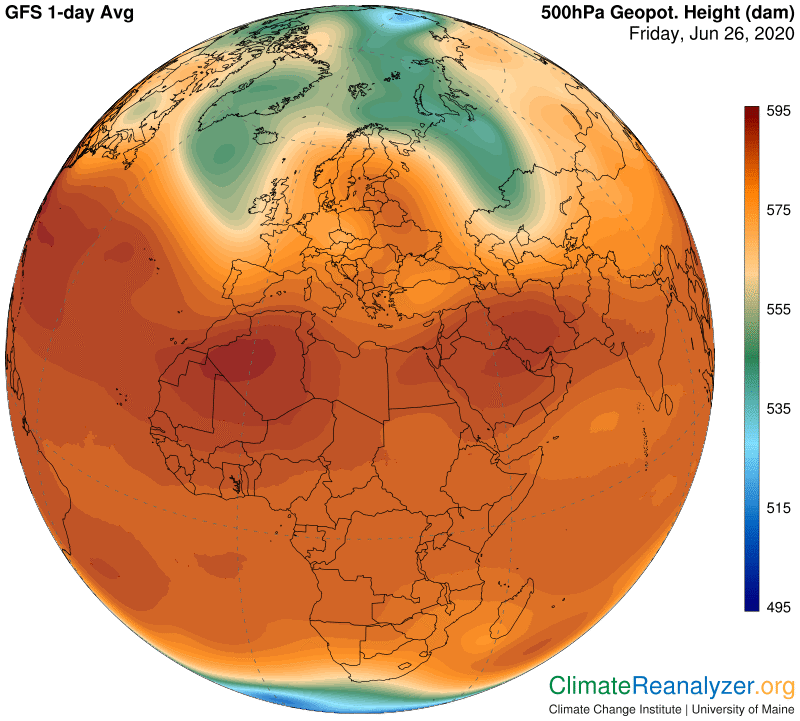
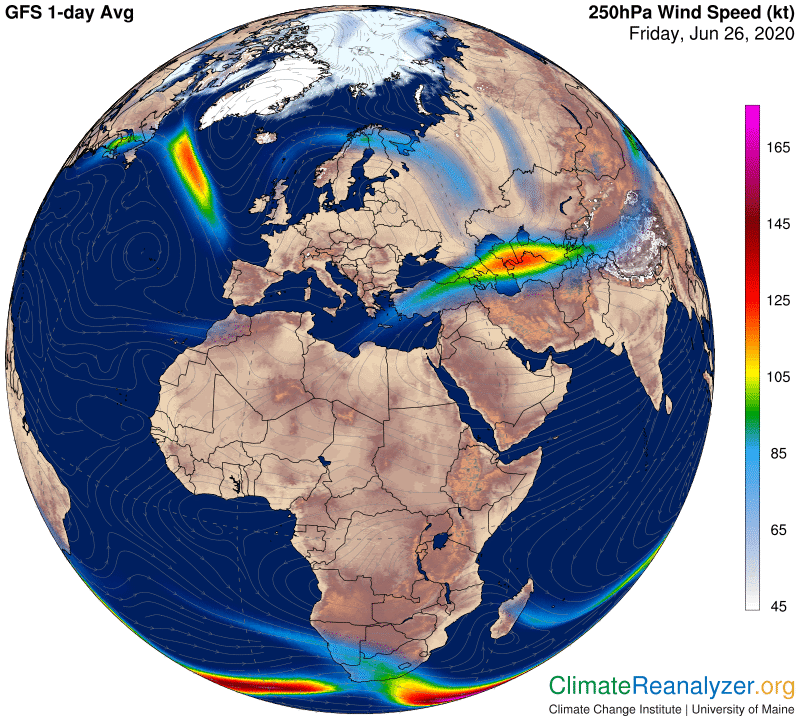
This first image shows how the dark blue area representing about 10C of cooling anomaly has substantially expanded in those two days. The second shows how its thumbprint on the 500hPa Geopot map has been altered as a result, followed by a picture of how this alteration has changed the pathway of the relevant jetstream wind:
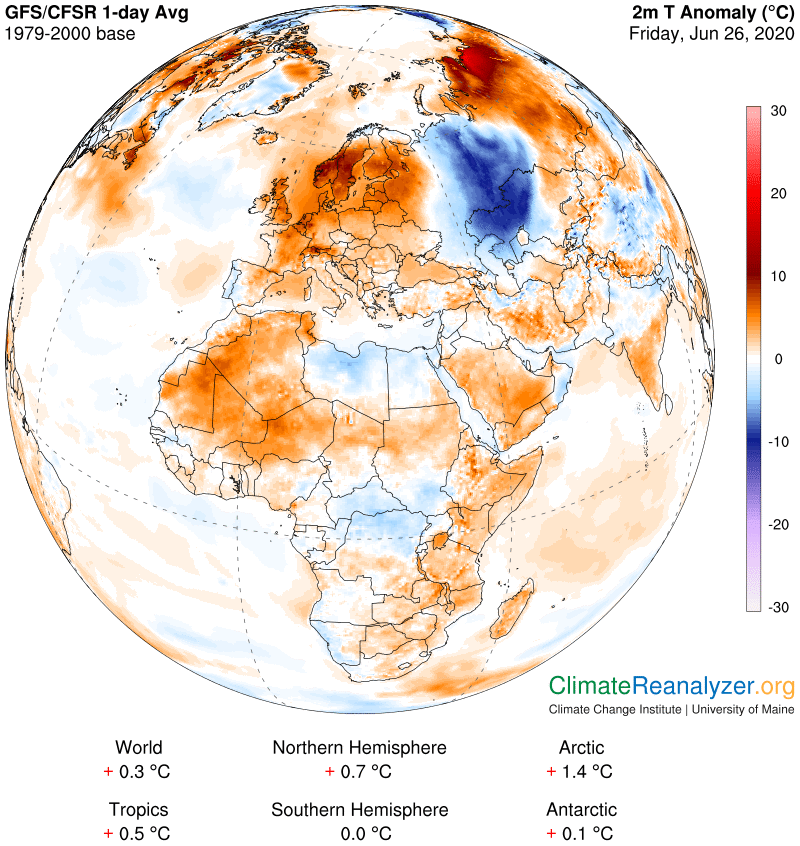
Notice how the green thumb has grown darker in shade and extends farther to the south than it did two days ago, an expected consequence of the strengthening and progressive movement happening in the zone bearing the coldest air:
The jetstream still tracks along the outer edge of the altered green zone, as it should, causing the loop to extend further south. There has been an increase in the strength and speed of the jets on each side. Also, the southern tip is now interacting with a portion of a completely separate jetstream pathway, causing a short burst of exceptionally high velocity to appear at that point:
This anomaly, and others like it, is subject to a number of complications that are not found in the warm type of anomaly and which I will not try to describe. How things develop from here is hard to predict, but I plan to be watching, using details from the Windy website for guidance. At this moment it appears to represent enough cooling power to fully offset either one of the two large warm anomalies that exist at its sides. More generally, I believe this kind of study related to the temperature effects of specific warm and cold anomalies should be a more common practice, potentially offering discoveries having real value for those who create climate forecast models.
Carl