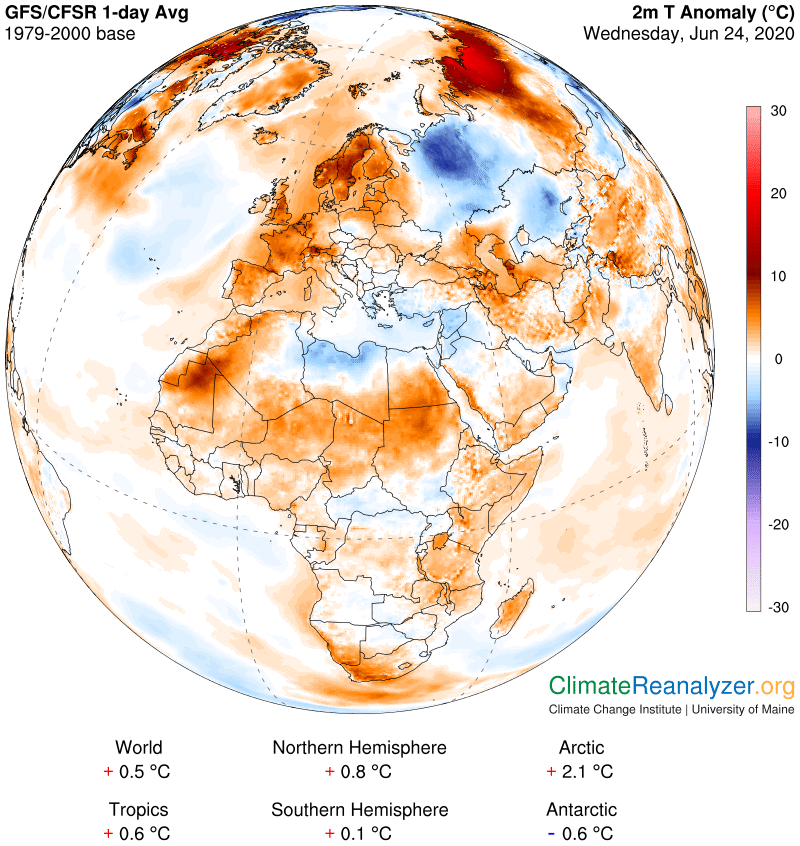
Following yesterday’s discussion about major cold anomalies I thought this would be a good day to see what could be learned about one of them, like what it might be made of. We already know how much these larger anomalies are helping to literally reduce the average temperature of the whole hemisphere. Potentially, the region inhabited by the one on the following map may also be ripe for matching the temperature increases observed over large areas to both the east and west at the same latitude, should the primary source of the cold anomaly disappear for some reason. That would be scary, making it essential that we be informed about the nature of this source, if possible. The one I have in mind is in western Russia, centered by the big spot of deep blue:
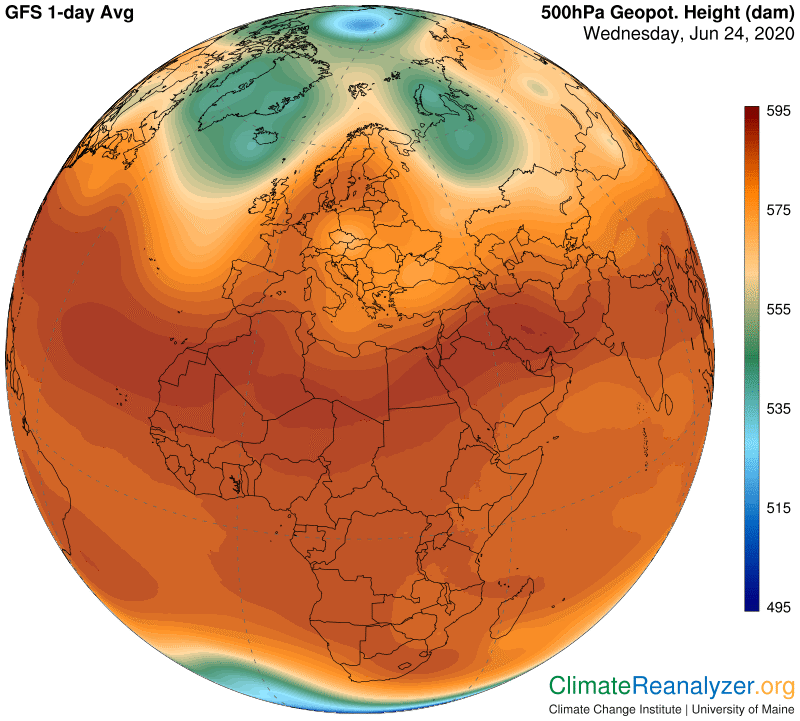
Because air always contracts when cooled, we have to expect that an anomaly of this size will create a substantial fingerprint on the air pressure pattern directly above, as recorded on the Geopot map, and sure enough, a big green thumb is visible in exactly the right place:
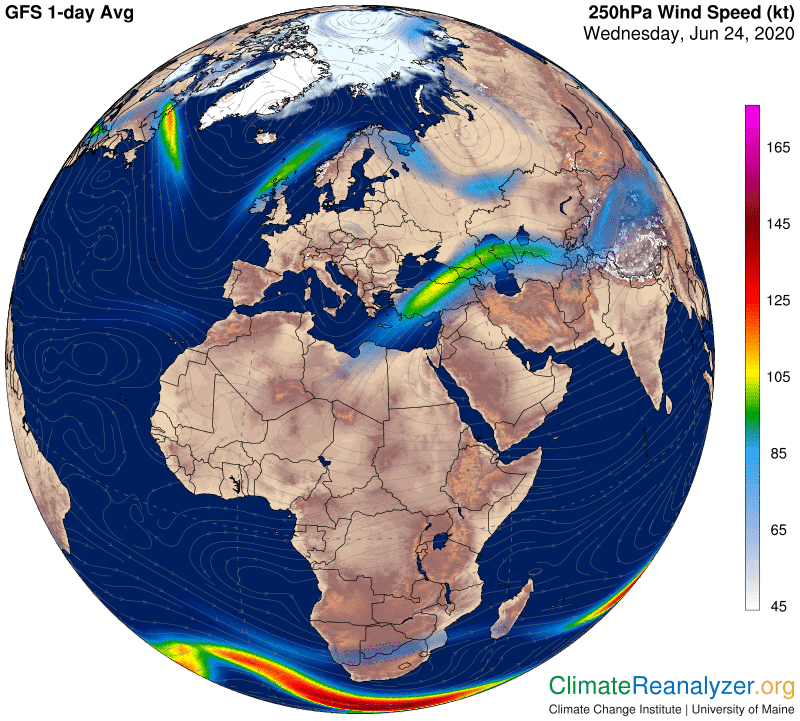
The outer edge of any zone shaded in green on these maps is known as the regular location of one of the major jetstream pathways, and this one is no exception, complete with several small jets that are now active:
The jets have the power to block the progress of much of the precipitable water that happens to be around, effectively preventing the vapors and their powerful greenhouse effect from passing over the planetary surfaced below the zone. As we see on this map, the surrounding water is plentiful and the jets are having some success in holding it back, thus contributing to the cooling effect we saw in the big temperature anomaly:
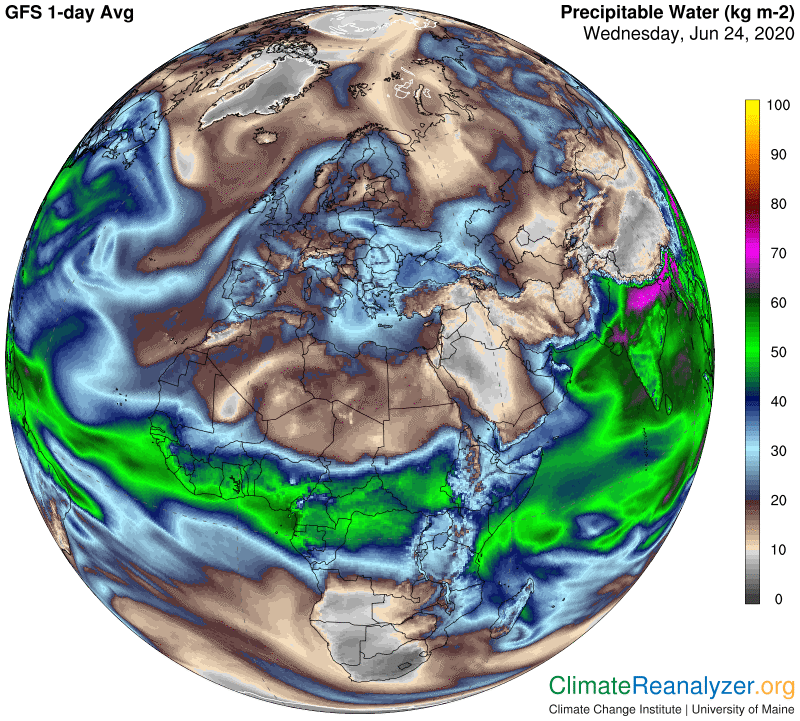
But is this cooling enough for a 10C anomaly? Probably not, as there is still a fair amount of vapor coming in, so we need to keep investigating. The best place to start is by opening the cloud map, and yes, there are ample clouds in sight plus quite a bit of rain as well:
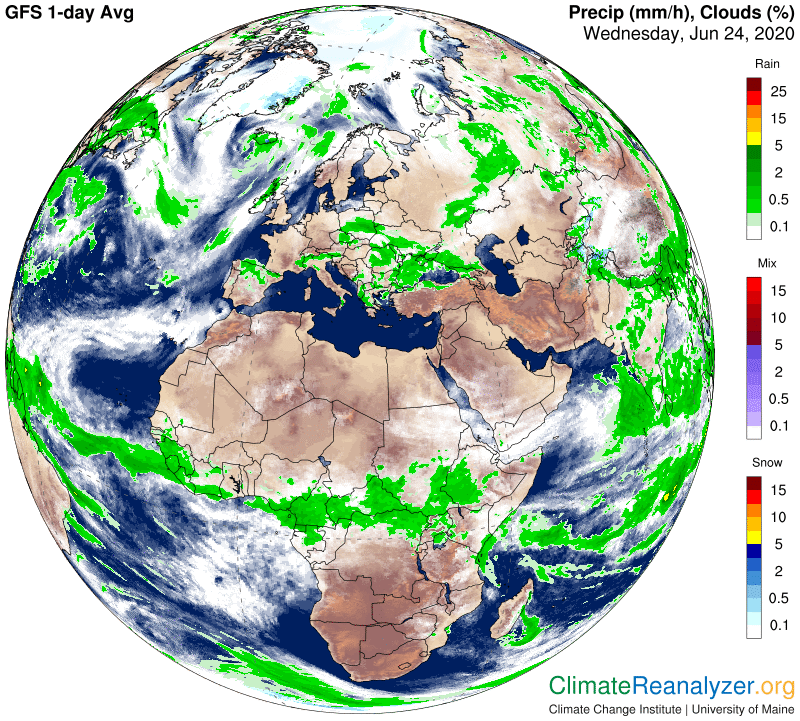
At this point we’re stuck, due to the limitations of the Weather Maps, which have nothing extra to say about clouds, but we do have Windy to go to, as described in yesterday’s letter. Windy has what we need for finishing this story, presented in images of great detail, but I can’t copy any of those images for purposes of showing. I can only say that what is there to be seen is almost the entire region of interest being filled to an unusual extent with low clouds, the bottoms of which are relatively close to the surface. Moreover, Windy is able to demonstrate, here and elsewhere as well, that whenever the cloud base has dropped to such a low level there is a tendency for air temperature to fall by several degrees in direct association. I think that’s all we really need to know to explain the amount of cooling. Except for one thing—why, or under what conditions, do these low cloud levels happen, and why are they so prevalent in some places but not in others?
Carl