“The Global Warming Effect of Airborne Water”
Last week I wrote about a plan to make changes in the content of these letters, to be largely built around information provided by the Today’s Weather Maps website. One aim is to promote more interest in studying those maps, and I also have another purpose, one separate but well-connected to the first, which is described in the above headline. This is a subject that gets a minimum amount of attention in the literature of climate science, and maybe even less in the presentations of meteorologists who operate on the daily weather side. I believe the study of this effect, both today and in future projections, belongs at the core of both sciences, and hope to somehow attract the attention of anyone who is willing to give more thought to the same general idea. The maps are full of buried treasures that I will try to bring to the surface.
“Airborne water” is a term I will be using simply as a replacement for “precipitable water.” It rolls off the tongue more easily, which is nice, and also offers a stronger suggestion of a journey in progress rather than a status quo. Every bit of the water takes off from the Earth’s surface as a vapor, becomes airborne, moves around, condenses, and finally, with very few exceptions, falls back down to Earth as some kind of precipitation. The part of the airborne journey that I find the most fascinating is the one where bits of water take off from tropical oceans, rise up several miles into the atmosphere, head off in the direction of higher latitudes, and do many twists and turns while facing obstacles and looking for more room to advance. A very small minority may be able to fly all the way over and past one of the poles before landing. Here is a map that shows the routes of two trails that have just accomplished the feat. (The live feed, most effective for only one day, is found at this link—https://climatereanalyzer.org/wx/DailySummary/#pwtr):
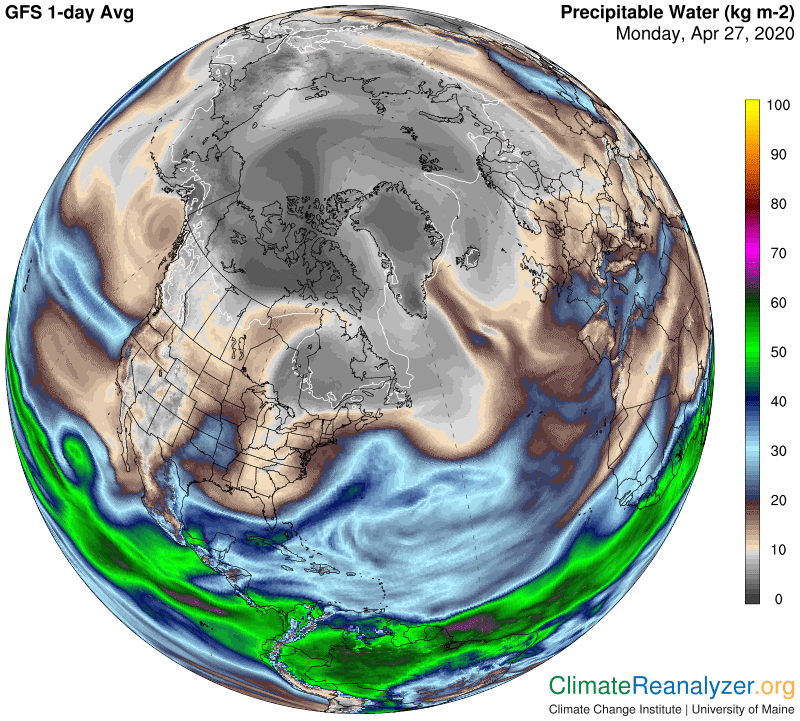
The most interesting thing happening today is that large masses of airborne water, both originating in the same general area of ocean waters adjacent to Central America , follow two completely separate courses on their northward journey. One course starts off mainly to the east, veers toward the middle of the Atlantic, then north past Iceland, both over and around the east side of Greenland, then over and past the North Pole with its few remaining bits. The other starts by moving straight north across the middle of the United States and well into Canada before turning east and finding an open path up Baffin Bay (on the west side of Greenland), whereupon its trail finally links to that of the eastern trail for the last short leg over the pole. These journeys do take several days to accomplish, and the precise locations of routes taken in their early parts could differ a bit from what we are seeing today, but the amount of shifting is not great. You can also spot the remains of an excursion from the other side of the globe that succeeded in reaching well into the Arctic Ocean but was then stopped short of the pole.
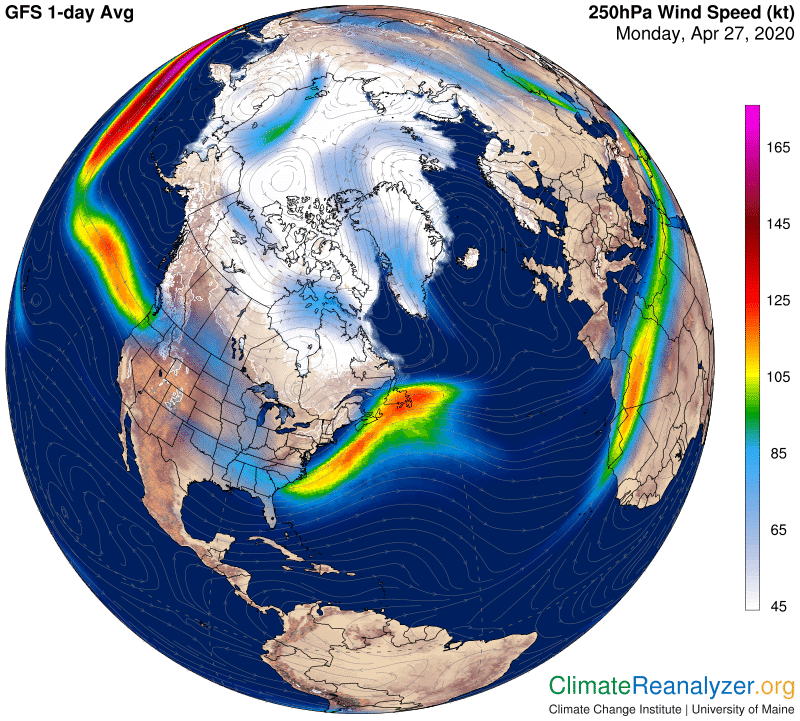
The next map gives a glimpse into the way jetstream wind action serves to influence the various changes in direction taken by these masses of airborne water as they wind their way northward. Some of the jets provide assistance, others block the path completely and still others just steer changes of their vector. The big looping wind you see around the north side of Greenland is currently positioned in such a way that both permits and assists the passage of water all the way over the pole, a rare coincidence. Most of these pulses do not stay in one place for a very long time.
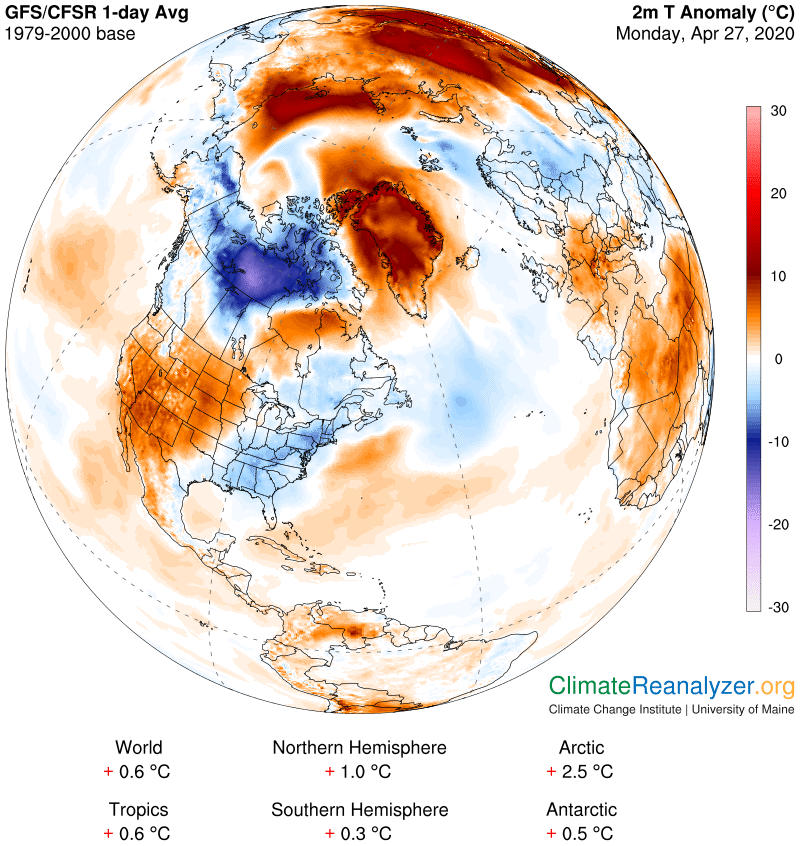
Finally, since our primary interest concerns the warming effect of airborne water, we turn to the temperature anomaly map to see the results along these two and any other similar routes that are now visible. Routes that move over land regularly warm up the air that exists right at the surface directly below, most extensively on days when the sky is clear. We can see plenty of such warming today below the western route. Over oceans it’s a different story. Surface air is mainly affected by heat exchange with the nearby water temperature, which itself changes at no more than a bare minimum rate, even between day and night. The biggest changes of all can take place over ice, as we see today, and that’s mainly because the normal reading for the total weight of overhead water is right around 1kg per square meter. It does not take much for the weight of an incoming airborne water flow to double or quadruple that figure, leading to anomalies of up to 20C, or more, as a fairly common occurrence. We even see some of this today on the Asiatic side of this map, from a strong water trail—mentioned earlier—that was stopped short of the pole. What are these maps going to look like a century from now, or in just one or two decades? Where is the model that can tell us?
Carl