I found another article about the Antarctic warming event that you may find interesting because of all the quotes from scientific experts: “https://www.theenergymix.com/2022/03/20/scientists-shocked-as-impossible-antarctic-heat-wave-sends-temperatures-40c-above-normal/. One paragraph is especially interesting: “The warm conditions were caused by an extreme atmospheric river of water vapour in the sky. When the river landed on the east coast it brought rain and moisture that spread over the continent, but a strong high-pressure system prevented the moisture from escaping. While it was trapped in place, the excessive moisture retained more heat than it would have under normal air conditions, while liquid-rich clouds radiated heat towards the surface.” This last sentence basically describes the workings of the greenhouse energy effect in any atmosphere. The effect is generated whenever outgoing longwave radiation from the surface, originally headed toward space, is instead trapped by substances suspended in the atmosphere and re-radiated in a normal way. About half of the re-radiated energy returns to the surface and is captured and added to the prevailing energy mix, where it soon becomes engaged in further processing. Air close to the surface is very much involved in this heat transfer activity and is warmed as a result. The warming happens bit by bit, at the speed of light.
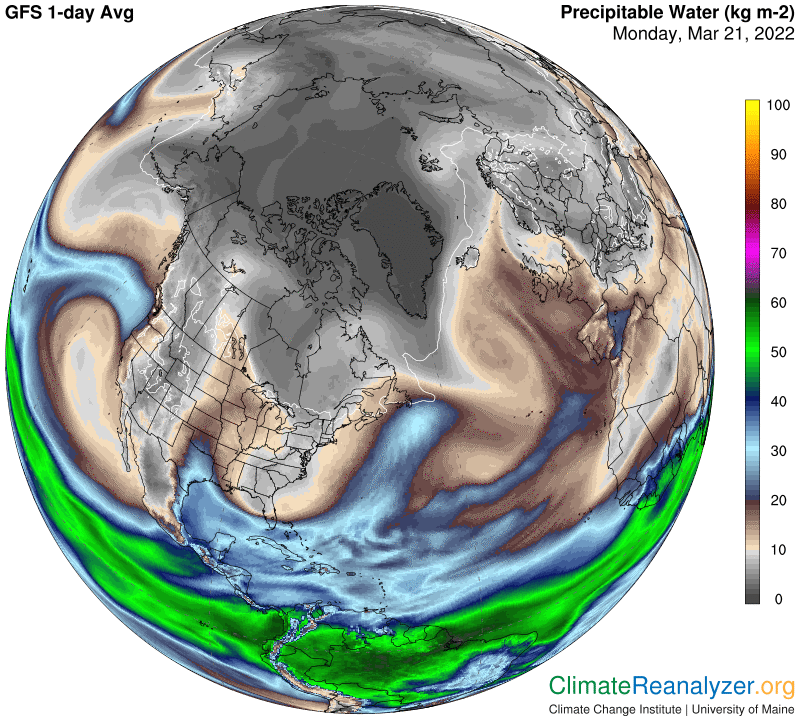
There are several things these scientists do not seem to understand about greenhouse energy. One is that it can be generated by particles other than gas molecules, as long as the particles are plentiful, suspended in the atmosphere, and have the ability to capture energy. Are there any liquid or solid objects that do not have that last-mentioned ability? Why not little drops and droplets of water, which happen to be very plentiful when partly condensed atmospheric rivers (ARs) are moving over? An AR can hold a concentration of greenhouse energy power in the form of PW, some of which is pure vapor, that is many times greater than the cumulative powers of all the ambient gases in the atmosphere directly below the river.
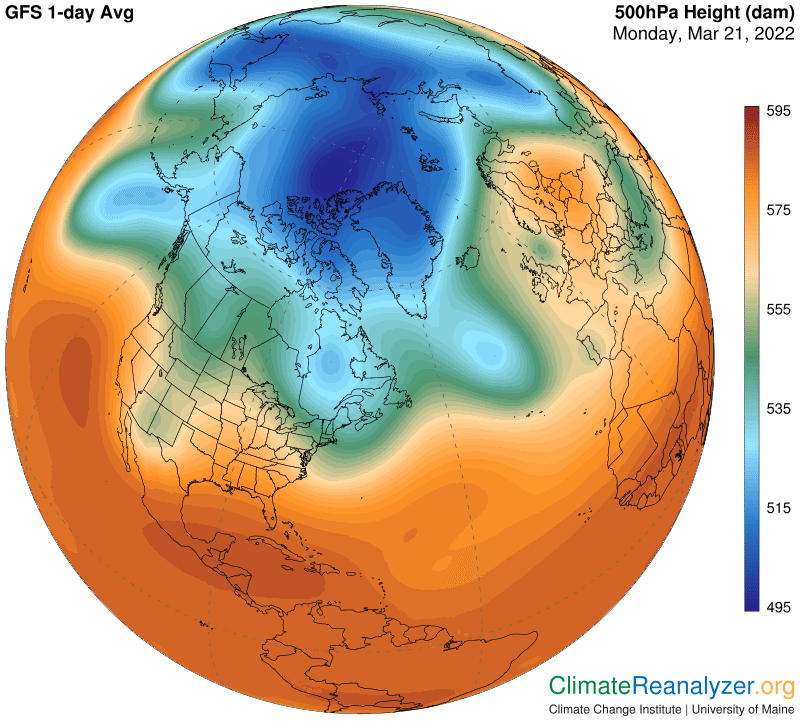
Another thing poorly understood is the concept that the greenhouse effect of all individual generators is delivered logarithmically. Whenever the amount of units of a generator in the atmosphere increases there is a corresponding decline in the power per unit. The logarithmic effect is such that each double in amount reduces the energy per unit by one-half. This is a well-known and publicized fact with respect to CO2 molecules but not established as such for other greenhouse gases or unrecognized generators like PW. By studying the weather maps I have had no trouble forming the consistent revelation that each double in the total weight of PW has a full 10C of warming power on surface air. Antarctica provides a unique venue where multiple doubles of PW can occur quickly and easily, and then vanish. This latest was an extreme example. The real question is what caused it to happen? I will stick with the answer provided here a few days ago, up to a point. We can see how the deep cavity in the high-altitude air pressure configuration was involved, admitting a powerful jet stream that was visibly transporting the AR, but what caused the cavity to form? The article mentions a “strong high pressure system” as a factor, which I think is likely but in need of a better proof and explanation.
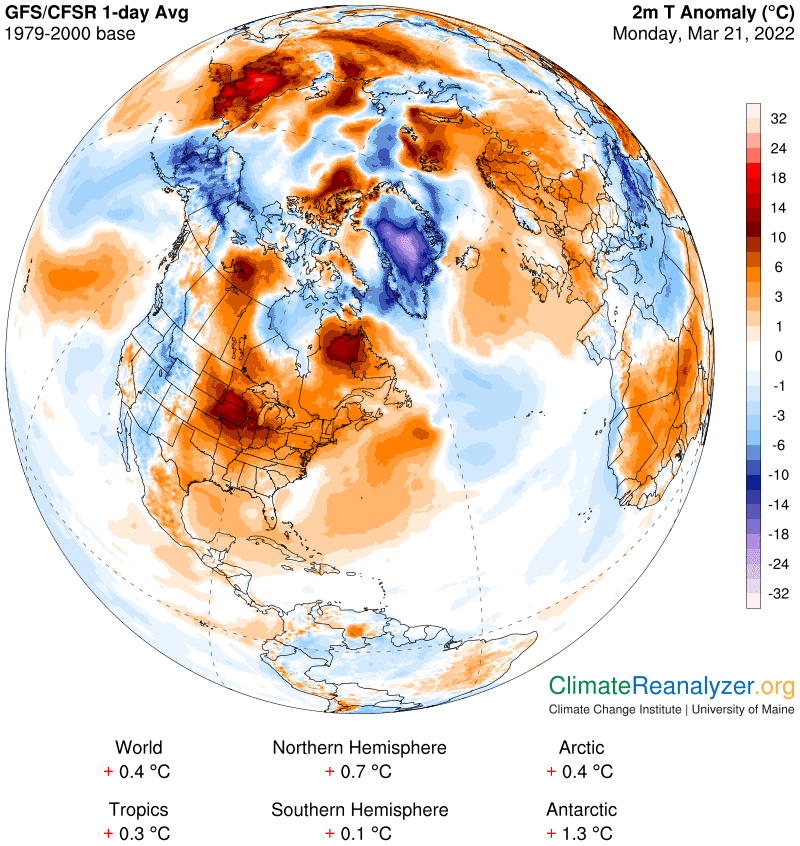
The Arctic today shows an almost flat anomaly-(from a baseline of 1979-2000) for the third time this month—about in line with the day’s global number. Map study suggests that ARs with plenty of PW are currently knocking at the Arctic door but having trouble being admitted, more so than we’ve come to expect. Jetstream winds are encircling the Arctic in positions that apparently do not favor advances in poleward movement by the ARs. The map of air pressure configuration is noteworthy because of the many appendages in the green zone that protrude from three of its sides, adding extra length to the totality of jetstream pathways.
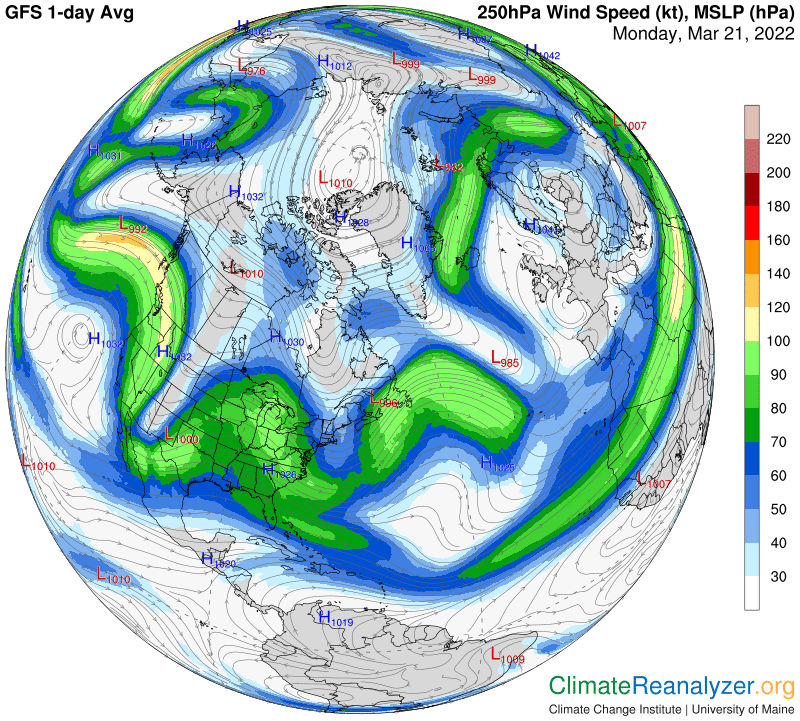
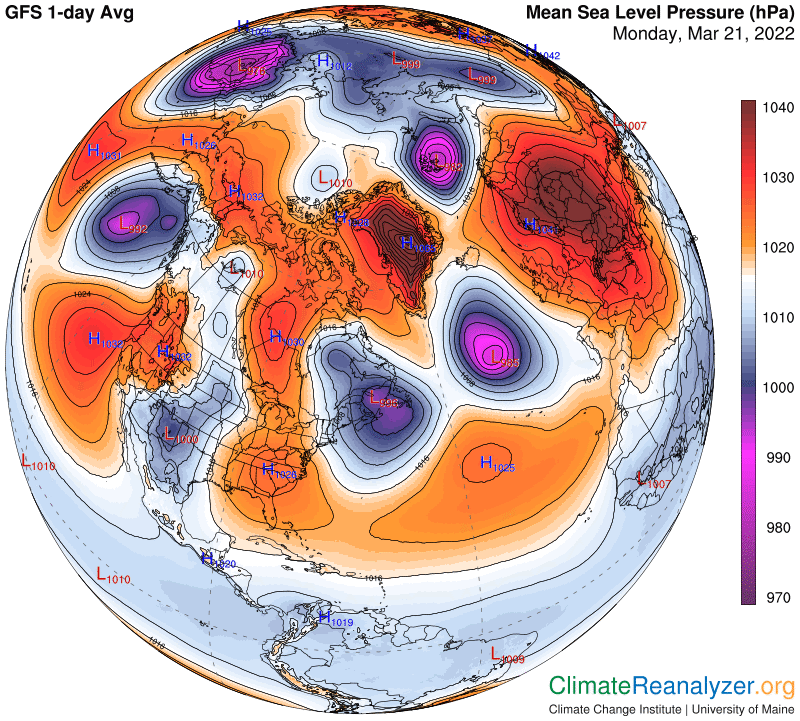
I’m adding one more image today, showing the pattern of sea-level air pressure. I notice that large blobs of low pressure are commonly associated in size, shape and positioning with the various appendages on the high-altitude air pressure map. This linkage could indeed have an effect on jetstream occurrence, positioning, and probable intermittent strength.
Carl