The Climate Letter is now devoted to investigating one of the possible sources of Arctic Amplification (AA). This is a unique opportunity for me to contribute something of value to science, which makes the project a personal priority. I want to kickstart an investigation of the greenhouse effect of precipitable water (PW), the principal component of atmospheric rivers (ARs), as a potentially significant source of AA. Some scientists have hinted at the possibility, but no systematic effort is in place, no underlying theory, and no understanding of the approach that must be taken in order to get meaningful results. I have already worked out the theory, and now I understand how the approach process must be undertaken, one day at a time. AA is a very irregular thing. Some days amplification happens, and on other days is doesn’t. The string of highs and lows forms a trend. Some days strengthen the trend and some weaken it. The trendline only comes into view after a long string of daily results are in place, and the records of daily analysis can then tell us how it happened.
The current trendline of AA has already been established. Arctic temperatures, on average, are increasing at a rate that is two or three times faster than those of the globe as a whole, a signature of the very definition of amplification. What’s missing is good information about why there is so much irregularity among the different days that constitute the body of the trend. When every day is known to have expressed a different result from those nearby, then by implication we must suspect some kind of irregularity in whatever is causing those results. In order to find that source of irregularity we need to gather up all the information we have available relating to each day, then sort things out and make comparisons. I don’t think any scientist has been following this type of procedure in a systematic way, one that is focused on the Arctic region. That is now my plan. My resources are strictly limited, to be sure, but I think there is nevertheless much to be accomplished just by concentrating on all of the information provided by Today’s Weather Maps, with an assist from animated constructions that more fully describe PW movement. My general theories about the greenhouse effects of PW were developed in this way. They still need to be put to a test systematically, and the Arctic is a perfect place to do the testing because of its compact size, many unique features and daily rollout of pertinent data.
For a quick illustration of what I mean by daily irregularity, here is a copy of a map showing the results of Arctic warming last Friday, February 25. It’s the only map I have for the day, meaning no interpretation, but do take a look at the numbers under the image:
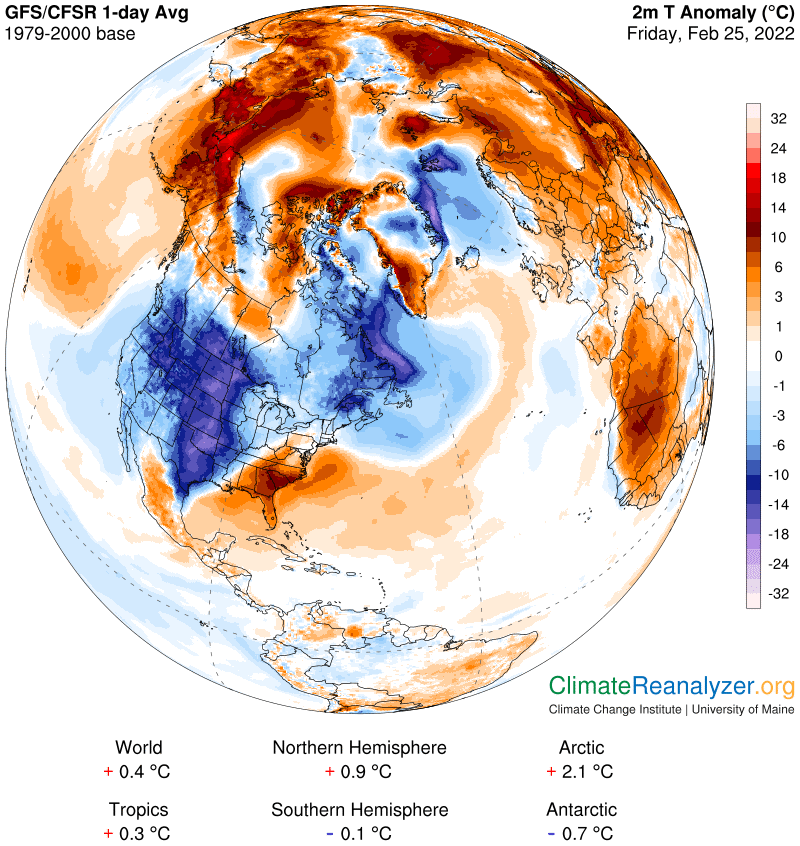
On the following Sunday I noticed that the Arctic had warmed up by another two degrees, to 4.0C, a truly extreme number. CL#2140 was published that day as a special explainer. On Monday another extreme came along at 3.9C, followed by a dip back to 2.9C yesterday. The sequence was not only volatile as it stood, but all four results revealed far greater multiples than just two or three times the global average. In other words, the regular trendline of amplification was itself being significantly amplified, most likely as a temporary extreme. Now let’s go to today’s map:
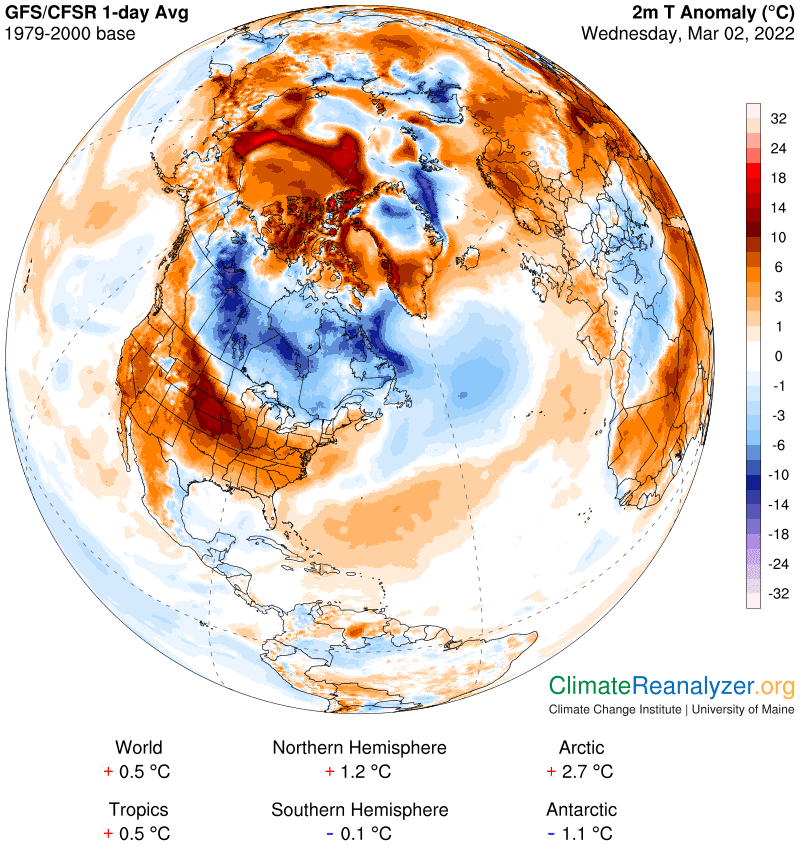
The Arctic number is down a bit, but still more than five times the global average. The 0.5C global number is itself right on trend, a function tied to the baseline period, which has an average age of three decades. All other results have numbers that are close to trend and have relatively low volatility from day to day. (The NH numbers are in fact generally more volatile than the others.) Now we can look for particulars in today’s Arctic, again featuring a large polar influx of PW arriving at both sides of the Bering Strait. Notice the little triangle of abnormally high PW value abutting the North Pole and see how that same small area reports an especially strong anomaly in the previous map:
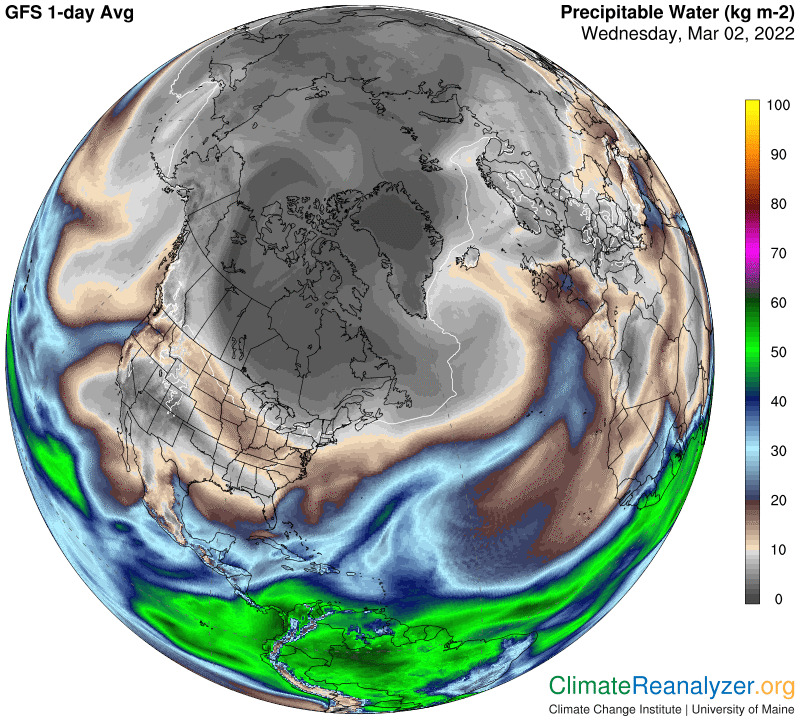
There is also a good bit of PW activity around southern Greenland, which I believe is partly driven by unusually high winds of the surface type:
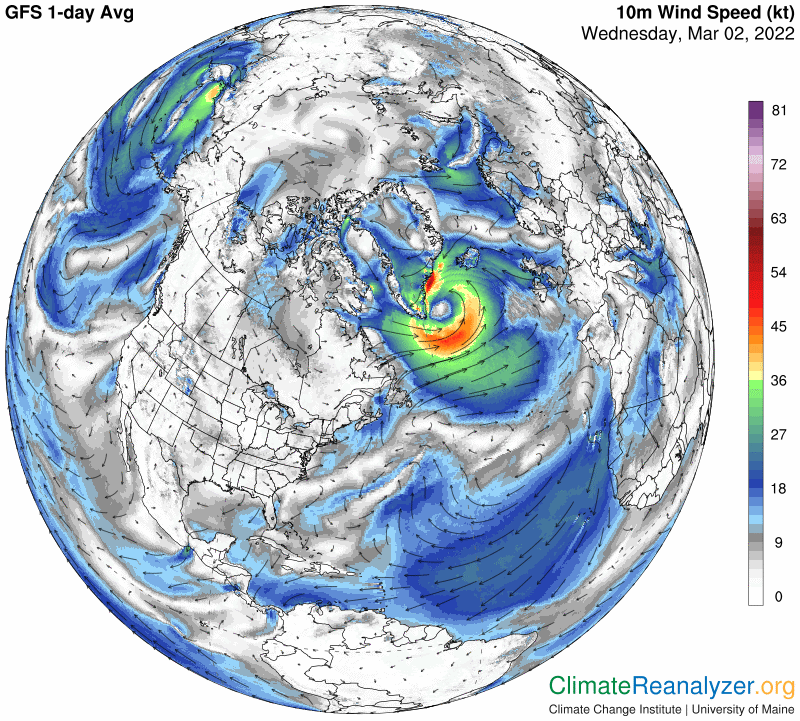
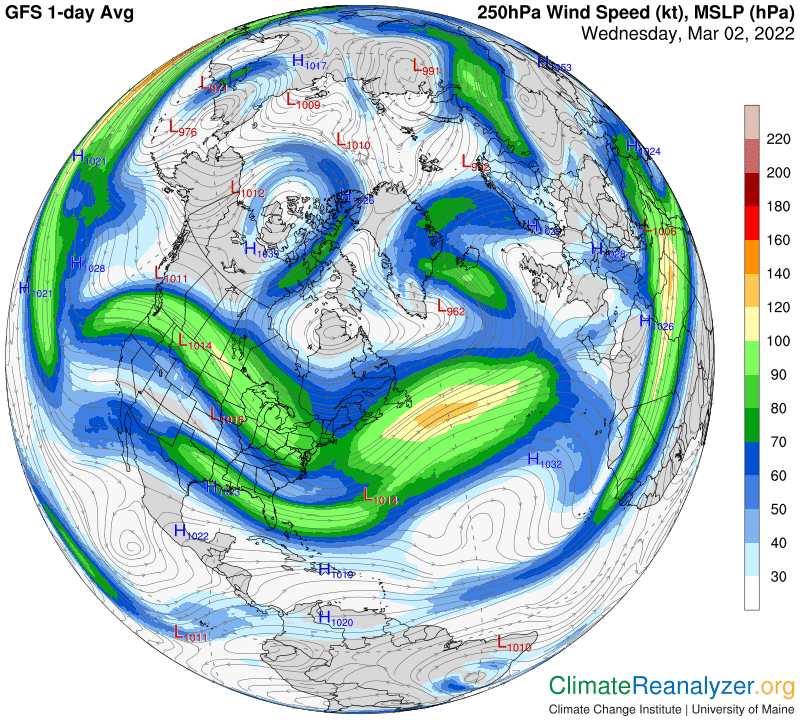
High-altitude air pressure configuration, as seen on the next map, is developing a new cavity in this area, which can only be of help to greater PW penetration if it keeps on growing. Meanwhile the large cavity on the Pacific side shows no sign of shrinking. Deformation of the ‘blue zone,’ by redirecting and weakening jet stream activity, has a key role to play in the enablement of PW movement into the polar zone:
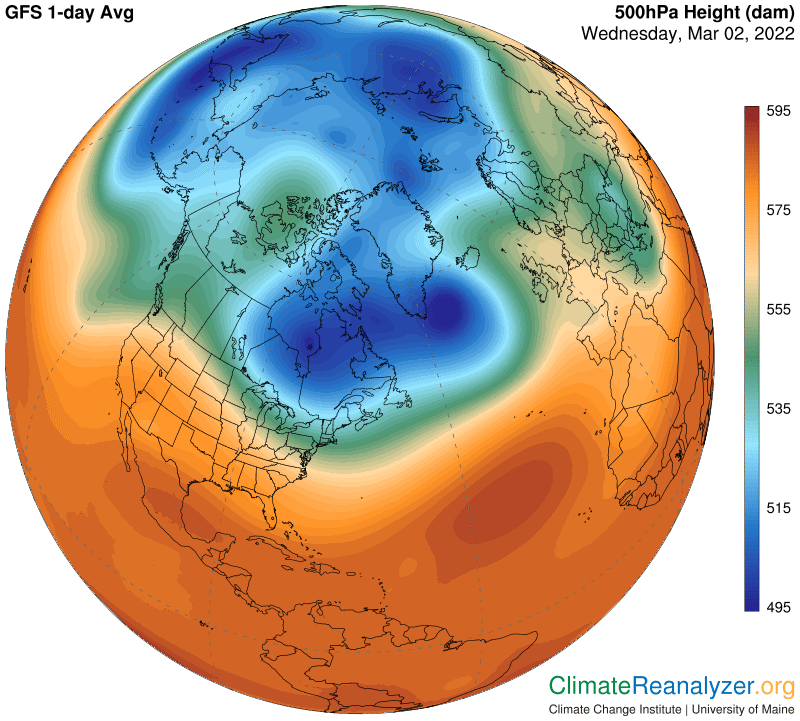
I had better show the jetstream map along with the others today:
Carl