An investigation into the cause of global warming trends. Earth is divided into five separate and distinct climate zones, each of which, with the exception of the Antarctic, has its own recorded temperature history all the way back to 1880. These histories are displayed within the contents of the following four charts, as derived from the highly informative Hansen group’s website at http://www.columbia.edu/~mhs119/.
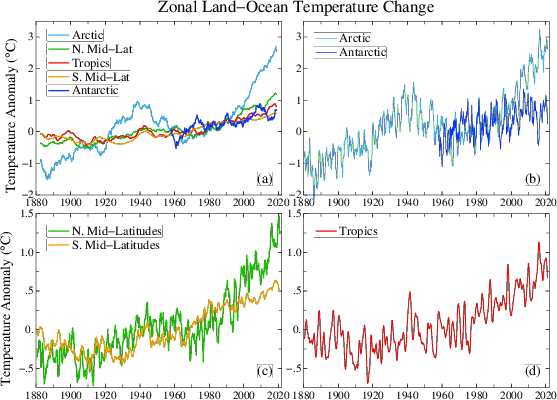
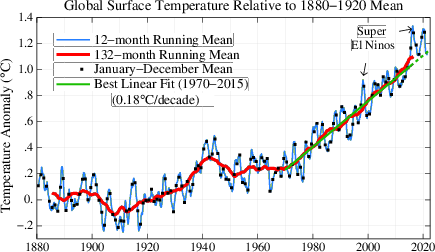
The temperature history of each of the zones can then be compared with the trend for the globe as a whole, as represented on the next chart. While we lose sight of Antarctica prior to 1960, holding back whatever influence it may have had on the global trend prior to that time, the chart in the upper left corner of the group of four certainly presents a clear view of the importance that a small polar zone, in this case the Arctic, can have relative to everything else:
The main thing that stands out is that the Arctic zone, in spite of its relatively small size in comparison with the three central zones, had an outsized effect on the global temperature “bulge” that peaked in the early 1940s, and is now doing the same thing again with respect to the very strong and extended global increase that began in the mid-1970s. The Arctic has gained nearly three degrees during that span. The northern mid-latitudes are second with about +1.5C, the tropics third with +1.0, the southern mid-latitudess next at just over +0.5 and finally the Antarctic with almost no gain at all. The tropical zone, which has the largest area of all, has come closest to matching the global average for the past 45 years or so while nearly all of the exceptional gains registered in the higher parts of the NH have been offset by below-average increases in the SH.
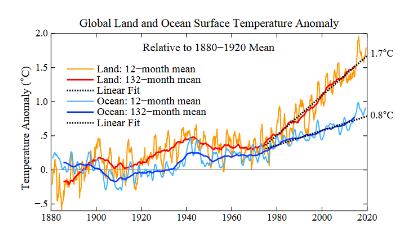
There is one more chart in the Hansen set that we should not forget about, which compares temperatures of land surfaces with those at sea: The entire globe is about 70% oceanic, and by far the greatest proportion of that water resides in the SH, but with only a small fraction of its total lying within the continental Antarctic region. The mid-latitudes are truly dominated by ocean surfaces.
All of these trends appear well-established and likely to continue, which raises a good many questions. What does a global average target of +1.5C mean for people living on land in the mid-latitudes if the NH, who are already exposed? The amplification of Arctic temperatures must involve something special in the way of causation. Do we have a full grasp of what that something is, or its ultimate potential, or the full extent of its reach into regions beyond? Is there a limit to how far behind land the ocean surfaces will continue to lag? How will they be affected in the SH by the great ice sheets of Antarctica, which are now showing signs of collapse? Looking further ahead, how, when and where might they return the heat they have been accumulating at depth for many decades? This is just a small taste of the things that are on our plate for study in the coming year.
Carl