In his November Temperature Update, reviewed in yesterday’s letter, James Hansen predicted that the global average will reach +2C by the middle of this century. He gives us a number of reasons which are pretty straightforward and hard to disagree with. So where could he go wrong? For one good answer the best person to turn to is none other than—James Hansen. Hansen was the lead author of a provocative 2016 study, entitled Ice melt, sea level rise and superstorms: +++, which covered many subjects of interest and has attracted much attention. Open access is available at https://acp.copernicus.org/articles/16/3761/2016/acp-16-3761-2016.pdf#abstract.1. One of the concluding sentences summarizes an important point: “Second, our study suggests that global surface air temperature, although an important diagnostic, is a flawed metric
of planetary “health”, because faster ice melt has a cooling
effect for a substantial period.” The study includes a chart which illustrates how and when that cooling effect will develop, under a pair of hypothetical circumstances, each depending on the rate of melting. When the melting is completed temperatures are predicted to make a rapid recovery to new highs, and ultimately catch up with the underlying trend of forcings:
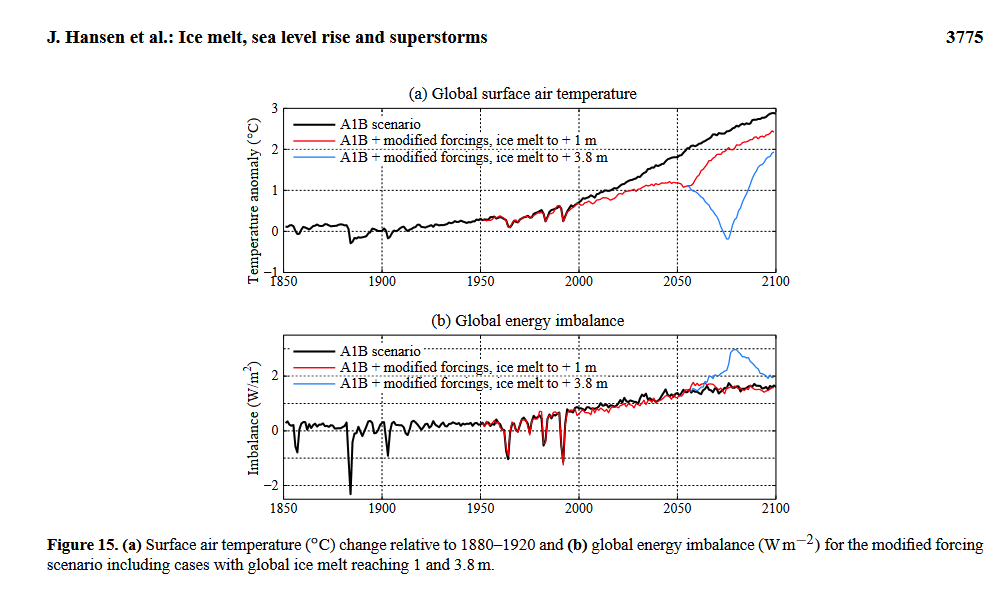
The thick blue line at the top corresponds with Hansen’s current.prediction. The red line represents a predicted alternative of very little gain from present levels if sea level were to rise one meter by mid-century. While it can’t be ruled out, this seems like an unlikely amount of sea level realization, but a foot or so can still be taken seriously as an estimate. That should be enough to hold back temperature gains by some fraction of a degree, for all of the reasons stated in the Hansen study. My personal views on this subject are gathered from imagery found in the weather maps, which is much more limited but still fairly potent, particularly with respect to cooling effects generated by active melting of ice that surrounds Antarctica. Let me bring up an image of what is happening right now with respect to the cooling of sea surface temperatures in that part of the world:
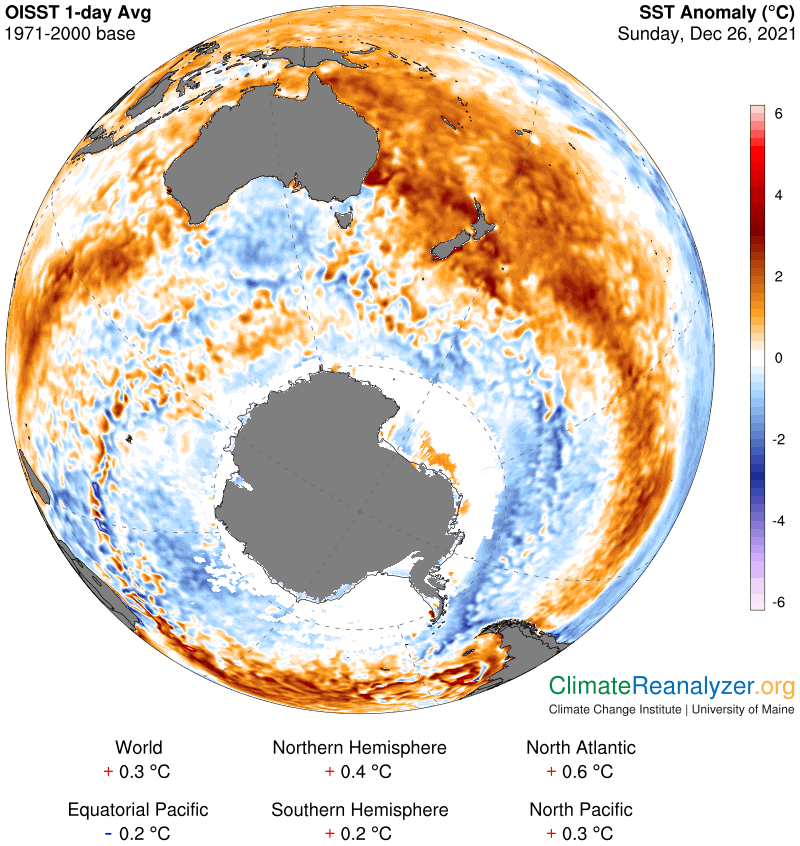
What I see is a thick band of anomalously cool seawater entirely circling the continent, having a width equal to around 15 degrees of latitude. This remarkable amount of change has all developed since the 1980s, during a period of sustained high-rate global warming. Temperature decreases can be seen approaching an amplitude of 2C in several areas. It is hard to imagine any source of so much cooling other than the effect of an abundance of melting ice, an actual reality which is in keeping with reports from many recent scientific observations. Large chunks of ice that break off and drift far away from the continent before completely melting can account for some of the lengthy distance of coverage. Ice cold water floating at the surface can be kept at that temperature by the presence of even colder—because it is more salty—water at a slightly lower level. The actual loss of ice is predominantly due to melting that occurs from currents of warm water that circulate beneath the thick shelves of ice that surround the continent, much less so from warm air above the surface. This subsurface processing, as established in the modern era, can work continuously during all twelve months of the year.
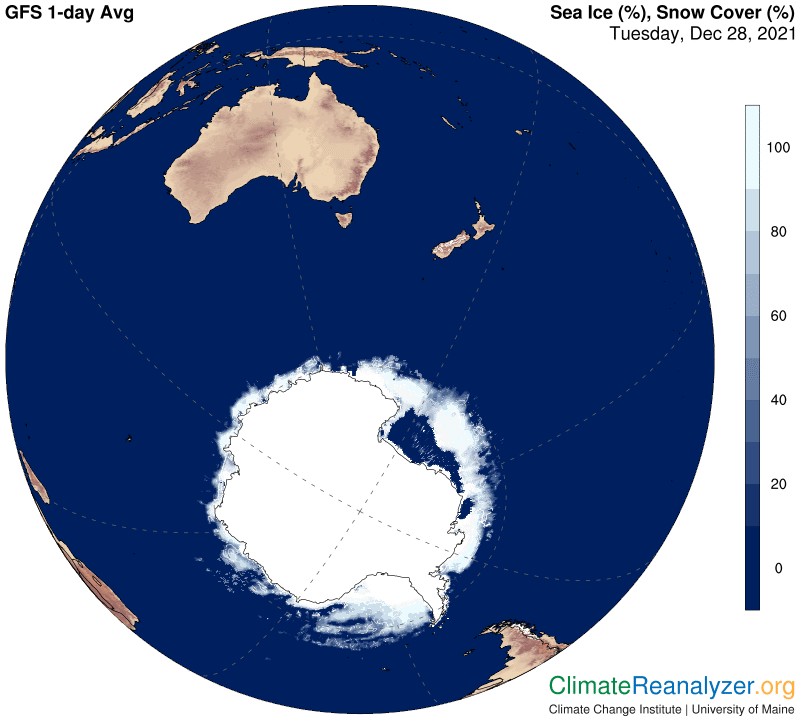
The seasonal sea ice that extends beyond the shelves has had a banner year of disintegration in 2021. No recent year is even close to matching it for reduced extent, as indicated on this website: https://ads.nipr.ac.jp/vishop/#/extent/&time=2019-04-01%2000:00:00. The map image that follows offers an indication of how little of this ice remains in place, with two months of additional fragmentation yet to come:
What a fascinating concept: warm water that circulates below the ocean surface can act as a cause of cooling of water on the ocean surface that even today is doing us a favor by helping to cool the air above the surface, and may continue to do so, increasingly, for many years to come.
Carl