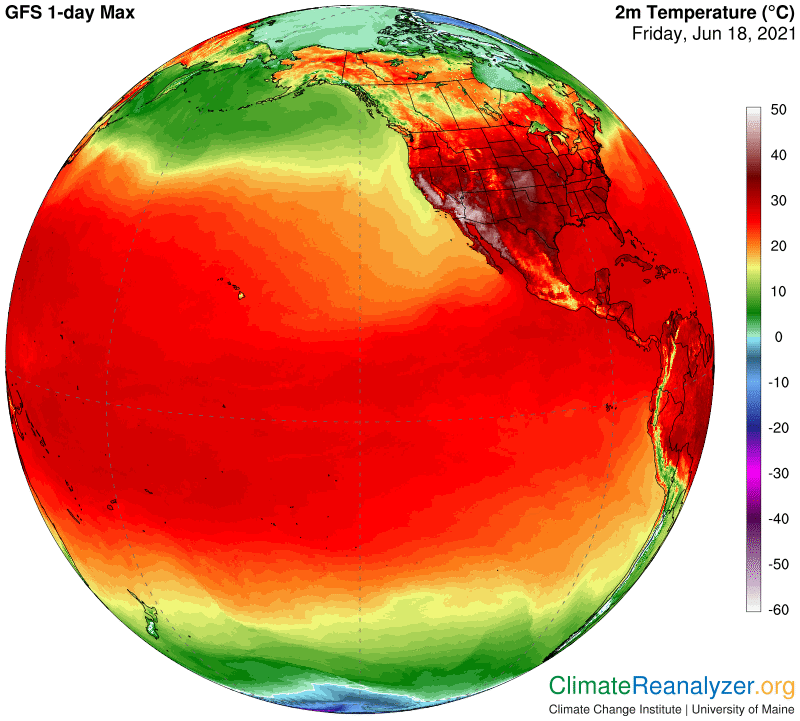
Today, a view of the now-notorious heat anomaly in the US, seen from the Pacific side:
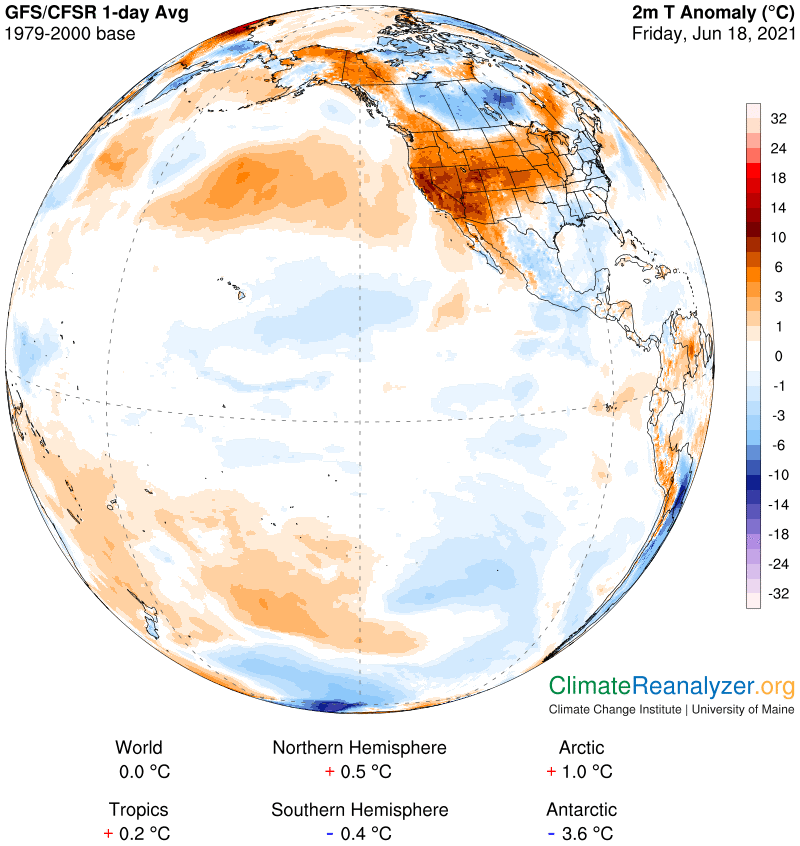
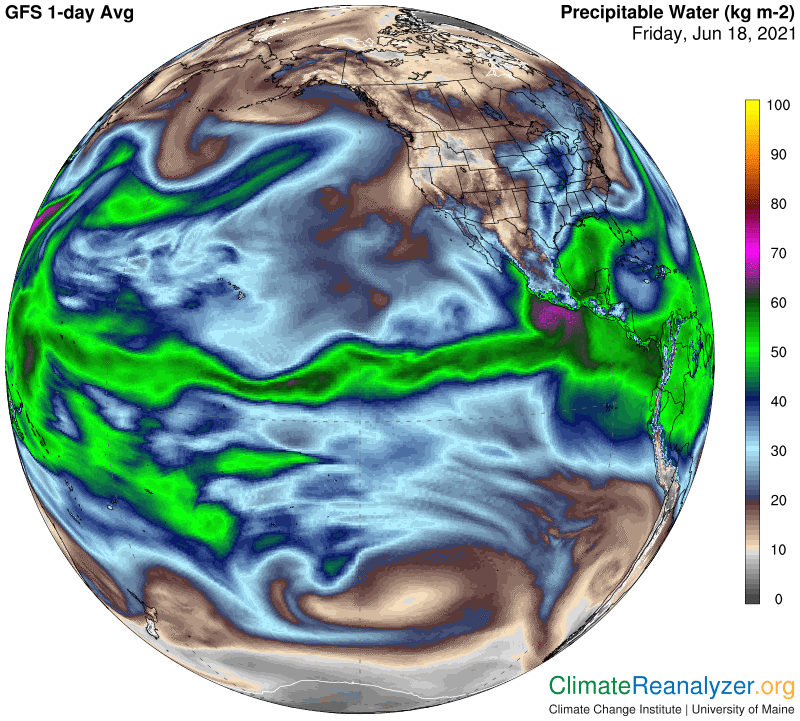
First, observe that parts of the US, Mexico and Canada have no such problem, nor does a vast expanse of the Pacific Ocean. In fact the entire globe today has the same average temperature as it did on a typical June 18th in the latter decades of the 20th century. The southwestern part of the US is having the worst luck of all. I am going to add a reason why this is so that you may not have heard of before: an abnormal amount of precipitable water (PW) in the atmosphere. You can get the details from imagery on this map, in the shape of large hand:
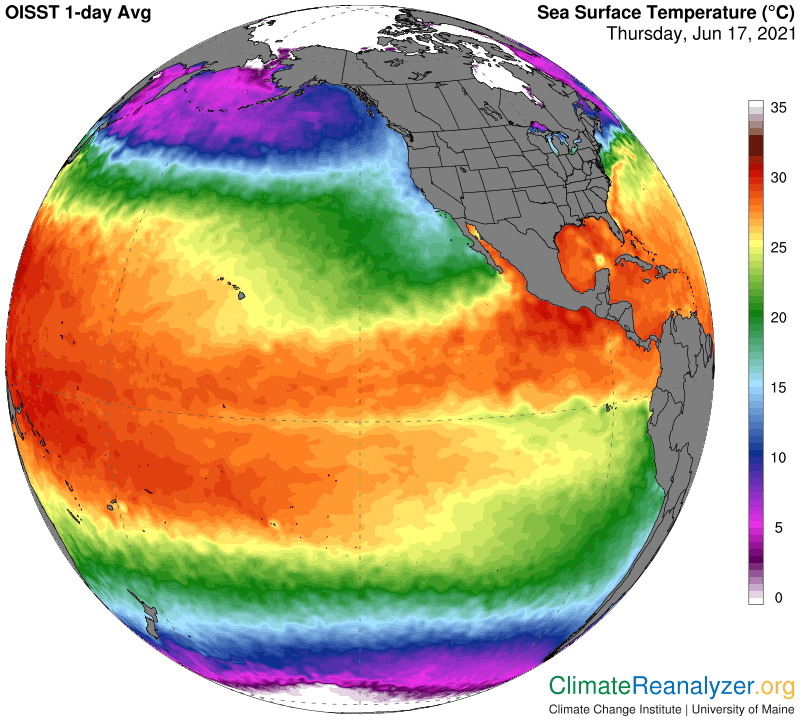
Where is all that PW coming from? Surely not from the Gulf of Mexico or the Caribbean Sea, which together are sending even larger gobs off in another direction. This batch is coming from a source that is seldom recognized, the Gulf of California. Like all semi-landlocked bodies of water this gulf is heating up in much the same way as the Persian Gulf on the other side. It’s a little bit smaller, and a little cooler, but otherwise the two have much in common, including latitude. Territories ringing the Persian Gulf traditionally stand out as the very hottest places on the planet in the summer, this year as always. Here’s a view of current water surface temperatures inside the Gulf of California and the outlet area just to the south of it:
The evaporation rate from those waters must be very intense, and very steady, and the vapors that emerge have to go somewhere. On the next map we can see no sign of them raining out, like so much vapor does around the Gulf of Mexico, nor even forming into clouds. Nor are they necessarily rising into the upper level of the troposphere, where they would encounter jetstream winds. These vapors may simply be mass-migrating in a northerly direction by ordinary diffusion with not much wind needed.
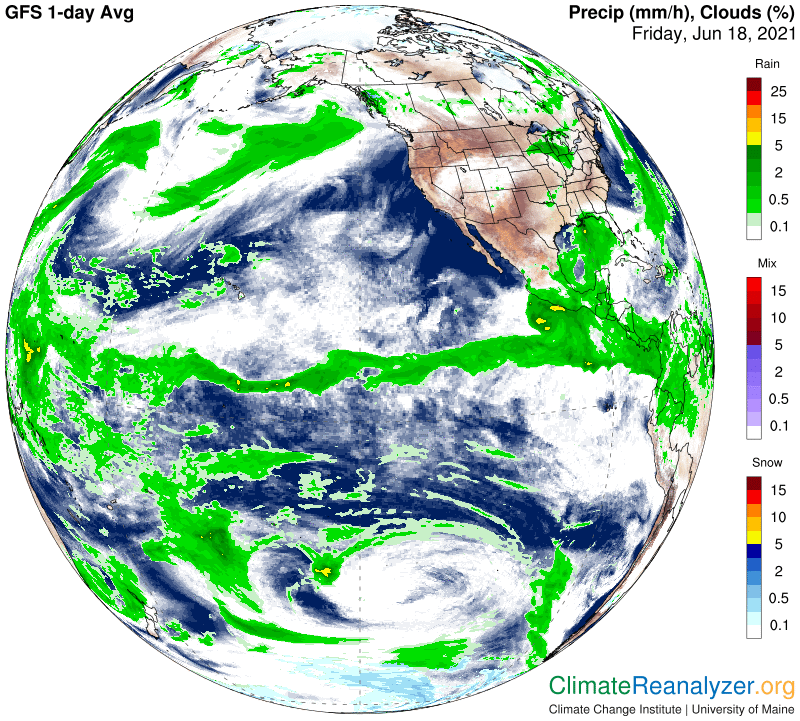
This map, by the way, helps to explain some of the cool anomalies mentioned earlier, where significant cooling is derived from albedo effects associated with thick and dark rain clouds at this time of year—as described in recent letters. Today we only need to think about what PW can do by itself when the sky is clear and the vapors are spreading over a region that in the past may often have had much less of it to deal with. Droughts and heat waves have a tendency to run in cycles, and so would the things that cause them. Right now, I have not heard of any reason for current trends to soon be changing. Here is a picture of what it means for maximum temperatures these days—check out the location of gray-shaded areas:
Carl