The two most salient of claims made by Carl’s Theory, as summarized in yesterday’s letter, should readily be illustrated on any given day by using images that come up on Today’s Weather Maps, so let’s go there. Today there is a fine example available in the eastern part of north Russia, where we are getting a strong temperature anomaly on the warm side with a reading that tops +21C (38F) over a quite sizeable area. We first want to know the extent to which precipitable water (PW) might be involved, and then look to see whether the theory’s claim of 10C per double of PW’s weight will stand up. That done, we will also want to look for some kind of explanation for why so much PW has made its way that far north in the first place, bordering the Arctic Ocean. This is not a region known for high humidity. First, the anomaly:
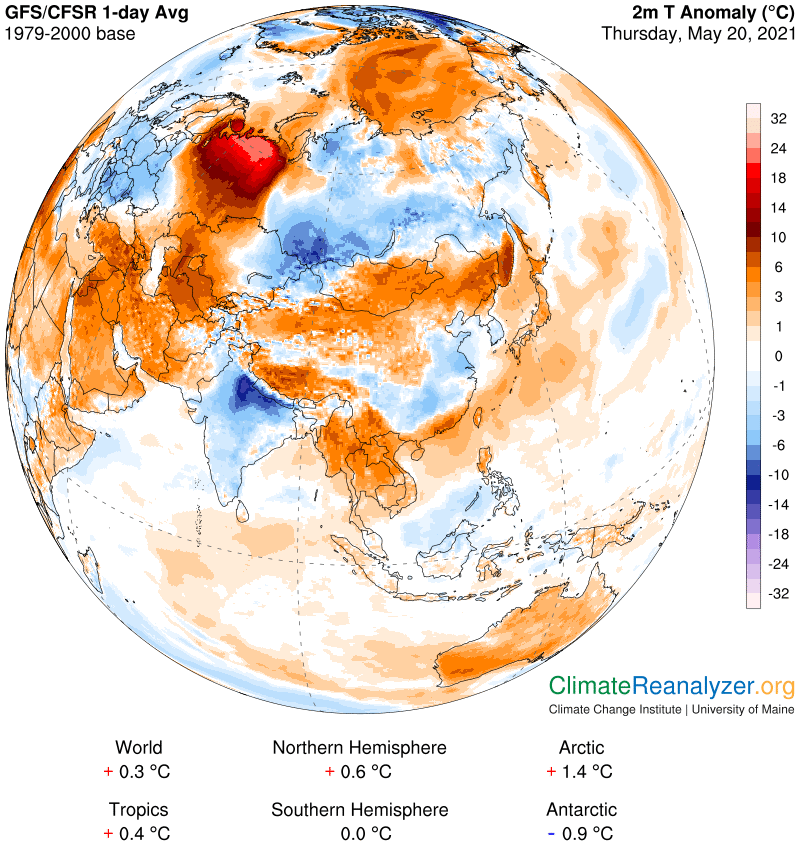
Incidentally, notice how almost the entire ocean is subject to a warm type of anomaly today, as it has been for much of the past month or more. Also, notice how not too far to the east of the big warm anomaly, at the same exact latitude, we see anomalies that are a few degrees below average. Why so much difference? Next, the PW map for the day:
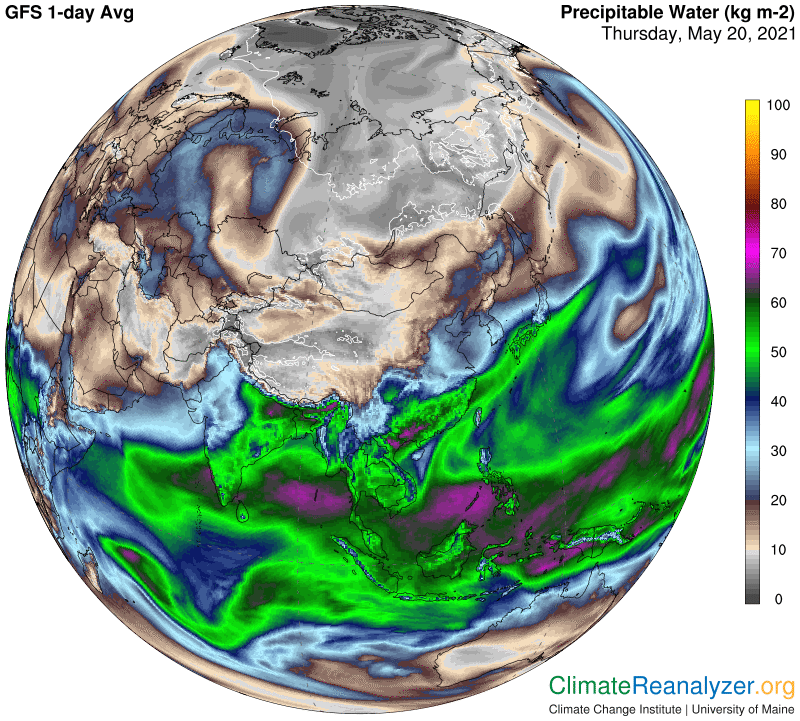
I see a massive incursion of PW in a range of 20-24kg, and it looks out of place when so many places at the top of Siberia are more like 5kg, with temperatures much cooler. The lengthy north/south dividing line between high and low could not be any sharper. Let’s see what actual average temperatures look like today, not just the anomalies:
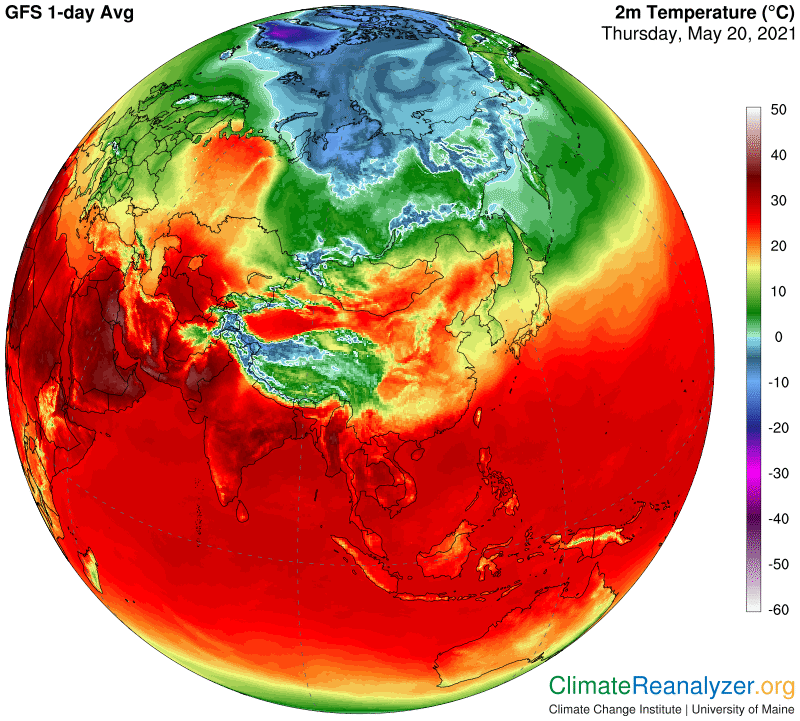
At the very top of the warm zone I see readings around 25C. Directly to the east, at the very same latitude, and again not far away, you run into the “zero line” as it wiggles around. Now you can do the math, comparing PW values and temperature values. Sure, there are other things that affect temperatures, like snow on the ground and cloud cover, and both of these are contributing something here, but how much of the 25 degrees (45F) could that be? Elevation hardly changes in this part of Russia. Are there any other suggestions? We don’t yet have perfect data on how current PW levels deviate from their historic averages for the day at specific locations, but some day I hope to see mapping that will do so. Today we’ve been able to work around this problem with little difficulty.
As promised, today’s maps can also give us a good idea about what all that PW happens to be doing up there, on the shores of the Arctic Ocean, and why its coverage is limited to this particular area, coming to an abrupt halt on a very narrow line. I won’t go into many details, but the looping jetstream wind we see on this map really does provide plenty of critical substance with respect to part 2 of Carl’s Theory. It perfectly matches the geographical position containing the high PW values:
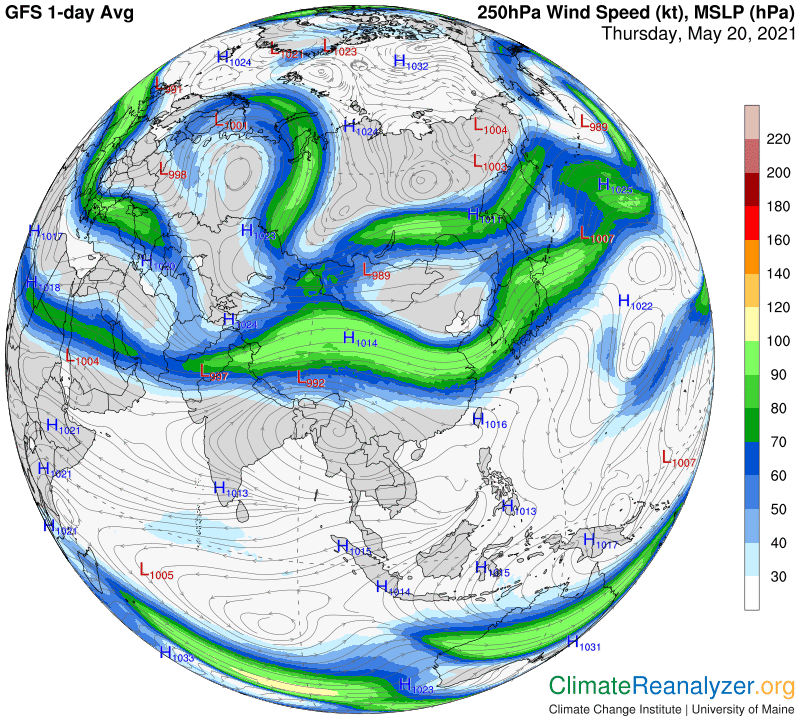
Finally, assuming that we have a solid background of understanding of where to look for the positioning of all jetstream winds, as governed by upper-level air pressure configuration, we should make a quick check of the latter on today’s map for verification. No problem at all. Just follow the border of the green zone to look for one of the major pathways:
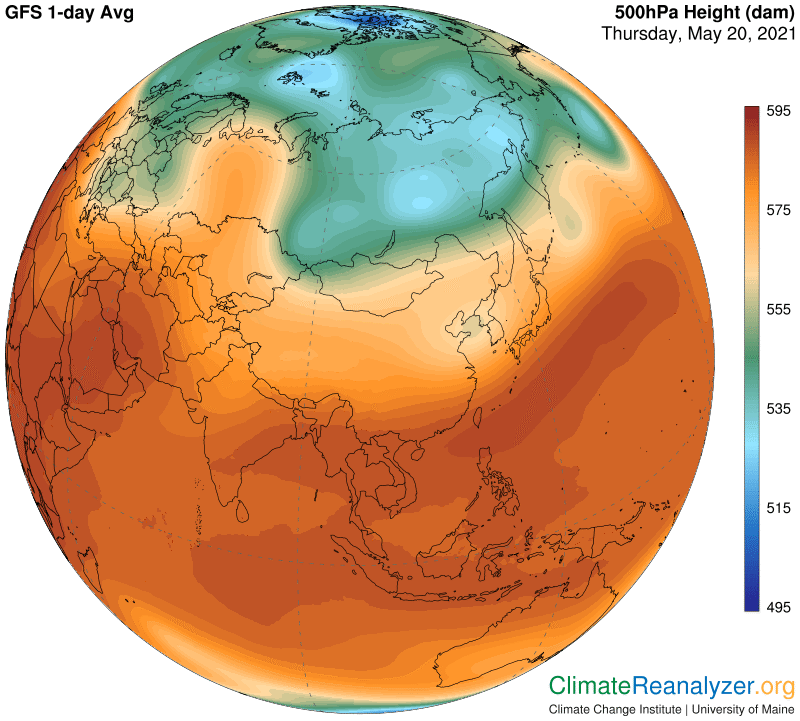
Carl