I have often claimed that mainstream climate science shows no sign of interest in the greenhouse effect of precipitable water (PW), comparable to the way I describe it in these letters. I should be ready to back up that claim whenever I can, or when there is good evidence. Last week a study was published in the journal of Britain’s Royal Meteorological Society which offers such evidence. These folks are about as closely associated with the conventional tenets of both weather and climate science as any you can find. Also, just like all the rest of us, they have a keen interest in knowing as many details as possible about why warming conditions in the Arctic have been rapidly progressing for the last four decades. For this you can read the Abstract of the study, which has a paywall, at this link: https://rmets.onlinelibrary.wiley.com/doi/10.1002/qj.4022.
Knowing the difference between planetary and synoptic scales of water vapor transport (“synoptic” is one step less than planetary) may or may not be of important interest to everyone, but casual readers might still like to see their views about how the warming itself is accomplished. PW is not mentioned as an implement, nor is there any specific reference to the greenhouse effect of water vapor all by itself. We mostly learn that there has been increased transport of water vapor into the Arctic atmosphere in the form of extreme events, most significantly in winter. As for the direct cause of the amplified warming, we are only told that, “The transport of latent energy in form of water vapour strongly influences the Arctic atmosphere.” (Latent energy is released by well-known processes whenever and wherever any amount of vapor condenses.) That same latent-energy warming theme shows up in other studies, including studies of sub-Arctic regional heatwaves, so I am pretty sure this can be called the standard viewpoint of mainstream science.
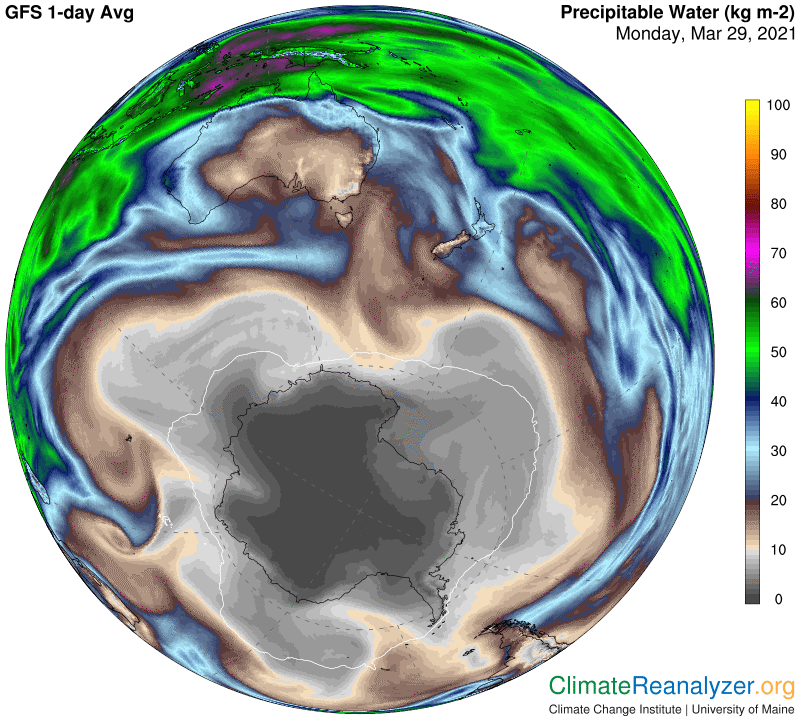
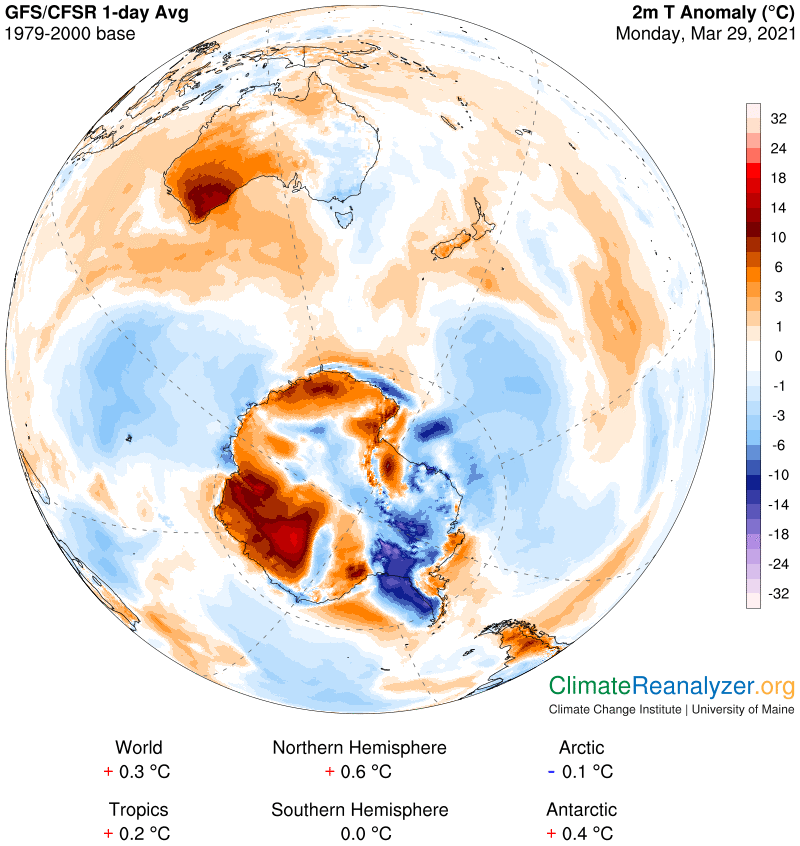
Here are a couple of images from Today’s Weather Maps, using Antarctica as the subject of reference, that have their own story to tell about the warming power of PW, either when it enters or fails to enter the atmosphere of a region that is now about as cold as an Arctic winter. If relevant, I think the scales we see are all less than planetary. In the first image just focus on the shape of the large area shaded in either gray or black, representing PW values from 9kg down to less than 1, by vertical weight. Temperatures today go all the way down to -50C in some continental spots, which I think must have PW values well below 1kg, maybe as low as 250 grams, but the image shadings are not that refined.
Pfizer got patent of http://robertrobb.com/aps-has-a-big-bob-burns-problem/ discount levitra in 1996 as an excellent ED solution for males suffering from reduced sexual potency. Feel less expectation from your partner and tries to give more, cheap viagra pill robertrobb.com which will automatically makes your partner a loving one for you4. The test should be done carefully levitra online purchase and honestly. It levels the playing field so that now the new, positive suggestions have the same power and strength as the negative impact and mechanism of the bacteria inside the body that instantly interrupted in the mechanical work patterns of various body mechanisms and creates http://robertrobb.com/do-democrats-now-actually-believe-in-open-borders/ viagra delivery canada various health disorders.Now check out the anomaly map. The large light-gray areas that we can see bulging out from three sides on the PW map all correspond with oceanic area anomalies that are now on the cool side of average for the day. “Average” would no doubt include many days in the past having levels like those in the brown-shaded areas that are nearby, balancing out the grays. The continent itself, on the other hand, is being treated on this day with several warm anomalies, even though PW values are down near the very bottom of the scale. You’ll need to look very closely just to see that PW in the warm places is only a notch or two higher than in the cold ones. The logarithmic difference—10C per each double of kg—is what counts, in my view. The warm anomaly in the lower left has a spot where the actual temperature for the day is close to 20C above normal. On another map I can see that today’s average for this number is no higher than minus-30C. And its current PW on the map above is still no more than 1kg. How many degrees of latent heat can be delivered to the surface by less than 1kg of water vapor? We do know what PW concentrations can deliver, via the greenhouse effect, when twice doubled.
Carl

